tethne.plot package
Module contents
-
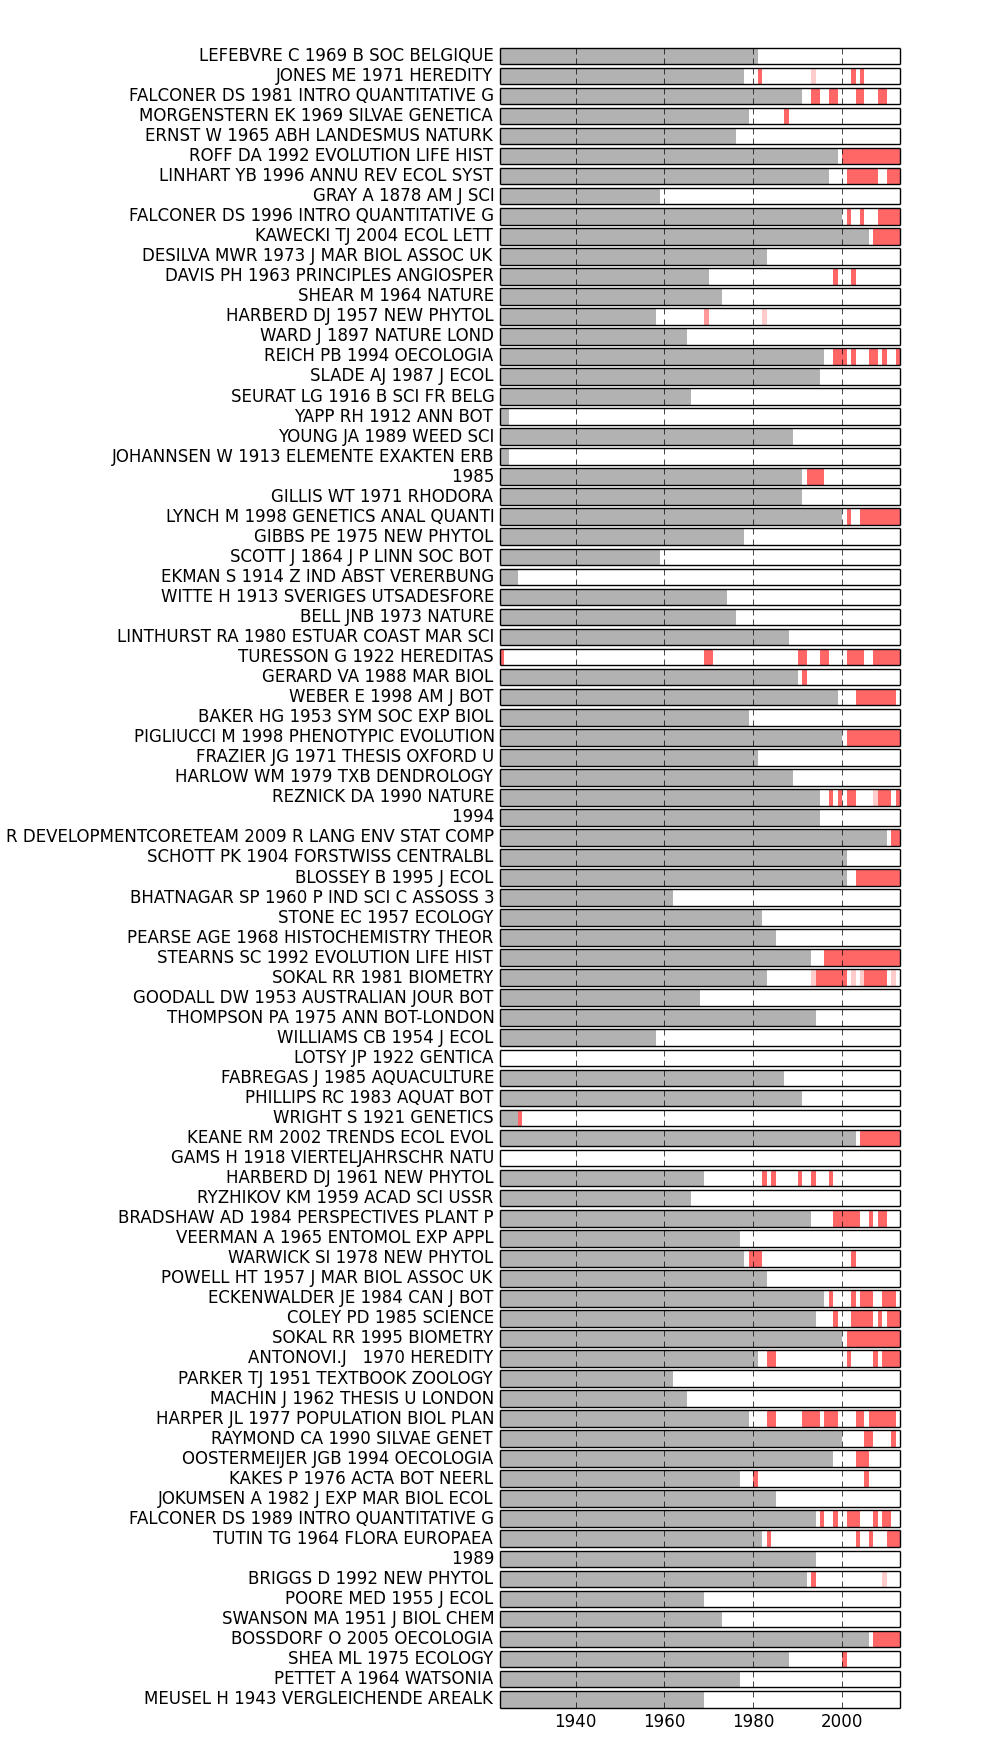
tethne.plot.plot_burstness(corpus, B, **kwargs)[source]¶ Generate a figure depicting burstness profiles for
feature.Parameters: B Returns: fig : matplotlib.figure.FigureExamples
>>> from tethne.analyze.corpus import burstness
>>> fig = plot_burstness(corpus, 'citations', topn=2, perslice=True)
>>> fig.savefig('~/burstness.png')
Years prior to the first occurrence of each feature are grayed out. Periods in which the feature was bursty are depicted by colored blocks, the opacity of which indicates burstness intensity.
-
tethne.plot.plot_sigma(corpus, sigma, nodes=None, **kwargs)[source]¶ Plot sigma values for the
topnmost influential nodes.Parameters: G :
GraphCollectioncorpus :
Corpusfeature : str
Name of a featureset in corpus.
topn : int or float {0.-1.}
(default: 20) Number (int) or percentage (float) of top-occurring features to return. If
flistis provided, this parameter is ignored.sort_by : str
(default: ‘max’) Criterion for selecting
topnnodes.perslice : bool
(default: False) If True, loads
topnfeatures per slice. Otherwise, loadstopnfeatures overall. Ifflistis provided, this parameter is ignored.flist : list
List of nodes. If provided,
topnandpersliceare ignored.fig :
matplotlib.figure.Figure(default: None) You may provide a Figure instance if you wish. Otherwise, a new figure is generated.
Returns: fig :
matplotlib.figure.FigureG :
GraphCollectionA co-citation graph collection, updated with
sigmanode attributes.Examples
Assuming that you have a
Corpus(G) sliced by'date'and a co-citationGraphCollection(corpus)...>>> from tethne.analyze.cocitation import plot_sigma >>> fig,G = plot_sigma(G, corpus, topn=5, perslice=True) >>> fig.savefig('~/sigma_plot.png')
In this figure, the top 5 most sigma-influential nodes in each slice are shown. Red bands indicate periods in which each paper was influential; opacity indicates the intensity of sigma (normalized by the highest value in the plot). The period prior to the first instance of each node is grayed out.
