tethne.classes.corpus module
A Corpus organizes Papers for analysis.
- class tethne.classes.corpus.Corpus(papers, features=None, index_by='ayjid', index_citation_by='ayjid', exclude=set([]), filt=None, index=True)[source]
Bases: object
A Corpus organizes Papers for analysis.
You can instantiate a Corpus directly by providing a list of Paper instances, and (optionally) some features over those papers, e.g. wordcounts. Once you have created a Corpus you can use it to generate a GraphCollection, or generate corpus or social models (see the model module).
You can create new Corpus objects from bibliographic datasets using the methods in readers. For more information about what you can do with a Corpus, see Working with Corpora.
N_axes Returns the number of slice axes for this Corpus. abstract_to_features Generates a unigram (wordcount) featureset from the abstracts of all Papers in the Corpus (if available). add_features Add a new featureset to the Corpus. all_papers Yield the complete set of Paper instances in this Corpus . distribution Get the distribution of Papers over one or two slice axes. feature_counts Get the frequency of a feature in a particular slice of axis. feature_distribution Get the distribution of a feature over one or two slice axes. filter_features Create a new featureset by applying a filter to an existing featureset. get_axes Returns a list of all slice axes for this Corpus . get_slice Get the Papers (or just their IDs) from a single slice. get_slices Get all of the Papers (or just their IDs) in a particular slice. index Indexes papers, features, and citations (if present). indices Yields a list of indices of all Papers in this Corpus. plot_distribution Plot distribution of papers or features along slice axes, using MatPlotLib. slice Slices data by key, using method (if applicable). transform Transform values in featureset fold, creating a new featureset fnew. Parameters: papers : list
A list of Paper instances.
features : dict
Contains dictionary { type: { i: [ (f, w) ] } } where i is an index for papers (see kwarg index_by), f is a feature (e.g. an N-gram), and w is a weight on that feature (e.g. a count).
index_by : str
index_citation_by : str
Just as index_by, except for citations.
exclude : set
(optional) Features to ignore, e.g. stopwords.
filt : function
Takes a lambda function that returns True if a feature should be included.
index : bool
(default: True) Set to False to supress indexing.
Returns: Examples
These examples deal with instantiating a Corpus using its constructor. To read about loading a Corpus directly from data, see Working with Corpora.
To create a Corpus from a JSTOR DfR dataset containing wordcounts, you might do:
>>> from tethne.readers import dfr
>>> papers = dfr.read('/path/to/dataset')
>>> wordcounts = dfr.ngrams('/path/to/dataset', N='uni')

>>> from tethne import Corpus
>>> MyCorpus = Corpus(papers, features={'wc':wordcounts}, index_by='doi')
>>> MyCorpus
<tethne.classes.corpus.Corpus object at 0x107975ad0>
readers.dfr and readers.wos provide some convenience functions for generating a Corpus directly from a dataset. For example:
>>> from tethne.readers import dfr
>>> MyCorpus = dfr.read_corpus('/path/to/dataset', features=('uni',))
>>> MyCorpus
<tethne.classes.corpus.Corpus object at 0x107975ad0>
You can organize your Corpus using the slice() method, and generate some descriptive statistics with distribution() and plot_distribution().
To save/load your Corpus (e.g. for archiving your data), you can convert it to or from a HDF5Corpus using hdf5.to_hdf5() and hdf5.from_hdf5().
- N_axes()[source]
Returns the number of slice axes for this Corpus.
Returns: N : int
Number of slice axes.
Examples
>>> MyCorpus.N_axes()
2
- abstract_to_features(remove_stopwords=True, stem=True)[source]
Generates a unigram (wordcount) featureset from the abstracts of all Papers in the Corpus (if available).
Words are automatically tokenized, and stopwords are removed be default (see parameters).
Parameters: remove_stopwords : bool
(default: True) If True, passes tokenizer the NLTK stoplist.
stem : bool
(default: True) If True, passes tokenizer the NLTK Porter stemmer.
Notes
TODO:
- Should be able to pass one’s own stemmer and stoplist, if desired. [Issue #23]
Examples
>>> MyCorpus.abstract_to_features()
>>> 'abstractTerms' in MyCorpus.features
True
- add_features(name, features, exclude=, []filt=None)[source]
Add a new featureset to the Corpus.
Parameters: name : str
features : dict
Keys should be Paper identifiers (:prop:`.Corpus.index_by`), and values should be distributions over features in sparse-tuple formats.
exclude : set
(optional) Features to ignore, e.g. stopwords.
filt : function
Takes a lambda function that returns True if a feature should be included.
Returns: None
Examples
>>> from tethne.readers import dfr
>>> bigrams = dfr.ngrams('/path/to/dataset', N='bi')
>>> MyCorpus.add_features('bigrams', bigrams)
- all_papers()[source]
Yield the complete set of Paper instances in this Corpus .
Returns: papers : list
A list of Paper instances.
Examples
>>> papers = MyCorpus.all_papers()
>>> papers[0]
<tethne.classes.paper.Paper at 0x10970e4d0>
- apply_stoplist(fold, fnew, stoplist)[source]
Apply stoplist to the featureset fold, resulting in featureset fnew.
Parameters: fold : str
Key into features for existing featureset.
fnew : str
Key into features for resulting featuresset.
stoplist : list
A list of features to remove from the featureset.
Returns: None
Examples
>>> from nltk.corpus import stopwords
>>> MyCorpus.apply_stoplist('unigrams', 'u_stop', stopwords.words())
- distribution(x_axis, y_axis=None)[source]
Get the distribution of Papers over one or two slice axes.
Returns a Numpy array describing the number of Paper associated with each slice-coordinate.
Parameters: x_axis : str
Name of a slice axis.
y_axis : str
(optional) Name of a slice axis.
Returns: dist : Numpy array
Values are the number of Paper at that slice-coordinate.
Examples
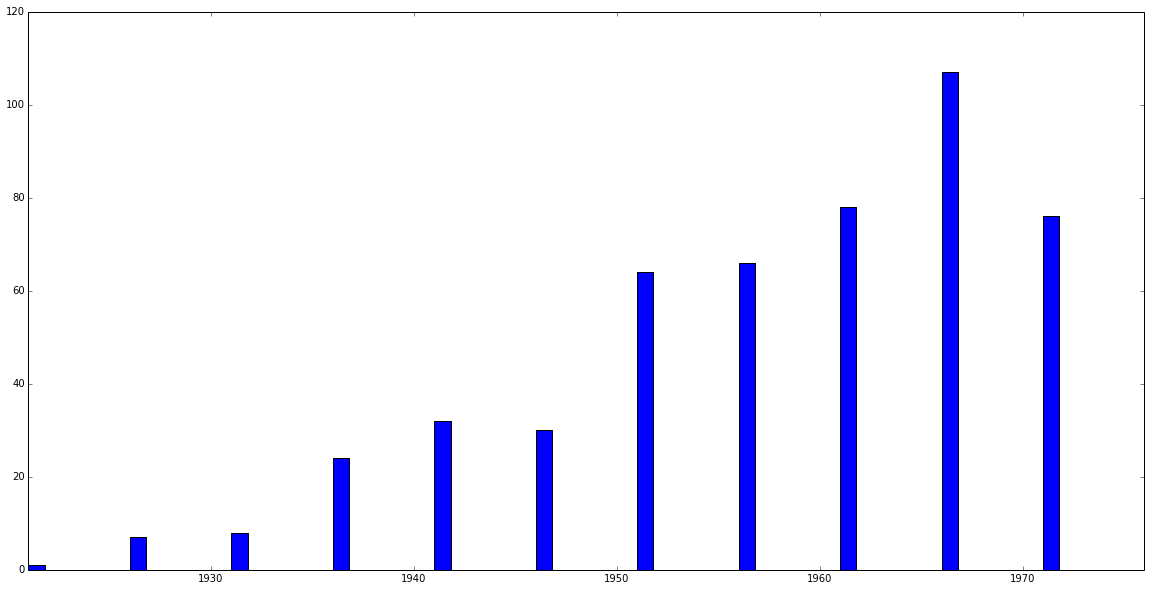
>>> MyCorpus.distribution('date')
array([[  1],
       [  7],
       [  8],
       [ 24],
       [ 32],
       [ 30],
       [ 64],
       [ 66],
       [ 78],
       [107],
       [ 76],
       [106]])
You can generate a figure for this distribution using plot_distribution().
- feature_counts(featureset, slice, axis='date', documentCounts=False)[source]
Get the frequency of a feature in a particular slice of axis.
Parameters: featureset : str
Name of a featureset in the corpus.
slice : int or str
Name of a slice along axis.
axis : str
(default: ‘date’) Name of slice axis containing slice.
documentCounts : bool
(default: False) If True, returns document counts (i.e. the number of documents in which a feature occurs) rather than the frequency (total number of instances) of that feature.
Returns: counts : dict
- feature_distribution(featureset, feature, x_axis, y_axis=None, mode='counts', normed=True)[source]
Get the distribution of a feature over one or two slice axes.
You can generate a figure for this distribution using plot_distribution().
Parameters: featureset : str
Name of a set of features (eg ‘unigrams’)
feature : str
String representation of the feature.
x_axis : str
Name of a slice axis.
y_axis : str
(optional) Name of a slice axis.
mode : str
(default: True) ‘counts’ or ‘documentCounts’
normed : bool
(default: True) If True, values are normalized for each slice.
Returns: dist : matrix
Notes
In the future, it may make sense to merge this into distribution().
Examples
>>> MyCorpus.feature_distribution('unigrams', 'four', 'date',
                             mode='counts', normed=True)
[[  7.10025561e-05]
 [  1.81508792e-03]
 [  3.87657001e-04]
 [  7.68344218e-04]
 [  9.81739643e-04]
 [  1.02986612e-03]
 [  5.04682875e-04]
 [  6.60851176e-04]
 [  1.02951270e-03]
 [  9.94742078e-04]
 [  1.04085711e-03]]
- filter_features(fold, fnew, filt=<function _filter at 0x10865a2a8>)[source]
Create a new featureset by applying a filter to an existing featureset.
filt is a method applied to each feature in the Corpus. It should return True if the feature is to be retained, and False if the feature is to be discarded. filt should accept the following parameters:
Parameter Description s Representation of the feature (e.g. a string). C The overall frequency of the feature in the Corpus. DC The number of documents in which the feature occurs. Parameters: fold : str
Key into features for existing featureset.
fnew : str
Key into features for resulting featuresset.
filt : method
Filter function to apply to the featureset. See above.
Returns: None
Examples
>>> def filt(s, C, DC):
...     if C > 3 and DC > 1 and len(s) > 3:
...         return True
...     return False
>>> MyCorpus.filter_features('wc', 'wc_filtered', filt)
Assuming that the Corpus MyCorpus already has a feature called wc, this would generate a new feature called wc_filtered containing only those features that...
- Occur more than three times overall in the Corpus,
- Occur in more than one document, and
- Are at least four characters in length.
- get_axes()[source]
Returns a list of all slice axes for this Corpus .
Returns: axes : list Examples
>>> MyCorpus.get_axes()
['date', 'jtitle']
- get_slice(key, index, papers=False)[source]
Get the Papers (or just their IDs) from a single slice.
Parameters: key : str
index : str or int
Slice index for key (e.g. 1999 for ‘date’).
papers : bool
(default: False) If True, returns Paper objects rather than just their IDs.
Returns: slice : list
Raises: RuntimeError : Corpus has not been sliced.
KeyError : Data has not been sliced by [key]
KeyError : [index] not a valid index for [key]
Examples
>>> MyCorpus.get_slice('date', 1926)
['10.2307/2470705',
 '10.2307/2480027',
 '10.2307/2255991',
 '10.2307/2428098',
 '10.2307/1654383',
 '10.2307/2256048',
 '10.2307/41421952']

>>> MyCorpus.get_slice('date', 1926, papers=True)
[<tethne.classes.paper.Paper at 0x109942110>,
 <tethne.classes.paper.Paper at 0x109922b50>,
 <tethne.classes.paper.Paper at 0x109934190>,
 <tethne.classes.paper.Paper at 0x109951410>,
 <tethne.classes.paper.Paper at 0x10971f350>,
 <tethne.classes.paper.Paper at 0x10975f810>,
 <tethne.classes.paper.Paper at 0x10975fed0>]
- get_slices(key, papers=False)[source]
Get all of the Papers (or just their IDs) in a particular slice.
Parameters: key : str
papers : bool
(default: False) If True, returns Paper objects rather than just their IDs.
Returns: slices : dict
Keys are slice indices. If papers is True, values are lists of Paper instances; otherwise returns paper IDs (e.g. ‘wosid’ or ‘doi’).
Raises: RuntimeError : Corpus has not been sliced.
KeyError : Data has not been sliced by [key]
Examples
>>> slices = MyCorpus.get_slices('date')
>>> slices.keys()
[1921, 1926, 1931, 1936, 1941, 1946, 1951, 1956, 1961, 1966, 1971]

>>> slices[1926]
['10.2307/2470705',
 '10.2307/2480027',
 '10.2307/2255991',
 '10.2307/2428098',
 '10.2307/1654383',
 '10.2307/2256048',
 '10.2307/41421952']
- index(papers, features=None, index_by='ayjid', index_citation_by='ayjid', exclude=set([]), filt=None, stem=False)[source]
Indexes papers, features, and citations (if present). This should be called automatically from __init__(), unless explicitly supressed.
Parameters: papers : list
A list of Paper instances.
features : dict
Contains dictionary { type: { i: [ (f, w) ] } } where i is an index for papers (see kwarg index_by), f is a feature (e.g. an N-gram), and w is a weight on that feature (e.g. a count).
index_by : str
index_citation_by : str
(default: ‘ayjid’) Similar to index_by, but for citations.
exclude : set
(optional) Features to ignore, e.g. stopwords.
filt : function
Takes a lambda function that returns True if a feature should be included.
- indices()[source]
Yields a list of indices of all Papers in this Corpus.
Returns: keys : list
List of indices.
Examples
>>> indices = MyCorpus.indices()
>>> indices[0]
'10.2307/20037014'
- plot_distribution(x_axis=None, y_axis=None, type='bar', aspect=0.2, step=2, fig=None, mode='papers', fkwargs={}, **kwargs)[source]
Plot distribution of papers or features along slice axes, using MatPlotLib.
You must first use slice() to divide your data up along axes of interest. Then you can use distribution() or plot_distribution() to generate descriptive statistics about your data.
Parameters: x_axis : str
Name of a slice axis to use for the x axis.
y_axis : str
(optional) Name of a slice axis to use for the y axis. If provided, uses PyPlot’s plt.imshow() method to generate a ‘heatmap’.
type : str
PyPlot method to use for 1-dimensional plots. (‘plot’ or ‘bar’).
aspect : float
When making a 2-d plot (i.e. y_axis is provided), sets the aspect ratio for the plot.
step : int
When making a 2-d plot (i.e. y_axis is provided), sets the range step for x axis tick labels.
fig : matplotlib.figure
(optional) If not provided, will generate a new instance of matplotlib.figure.
mode : str
(default: ‘papers’) Specify whether to plot the distribution of ‘papers’ or ‘features’. See examples, below.
fkwargs : dict
Keyword arguments passed to PyPlot method.
Returns: fig : matplotlib.figure
Examples
The default behavior is to plot the distribution of paper across x_axis (and y_axis):
>>> MyCorpus.slice('date', method='time_period', window_size=5)
>>> MyCorpus.plot_distribution('date')
Should generate a plot that looks something like this:
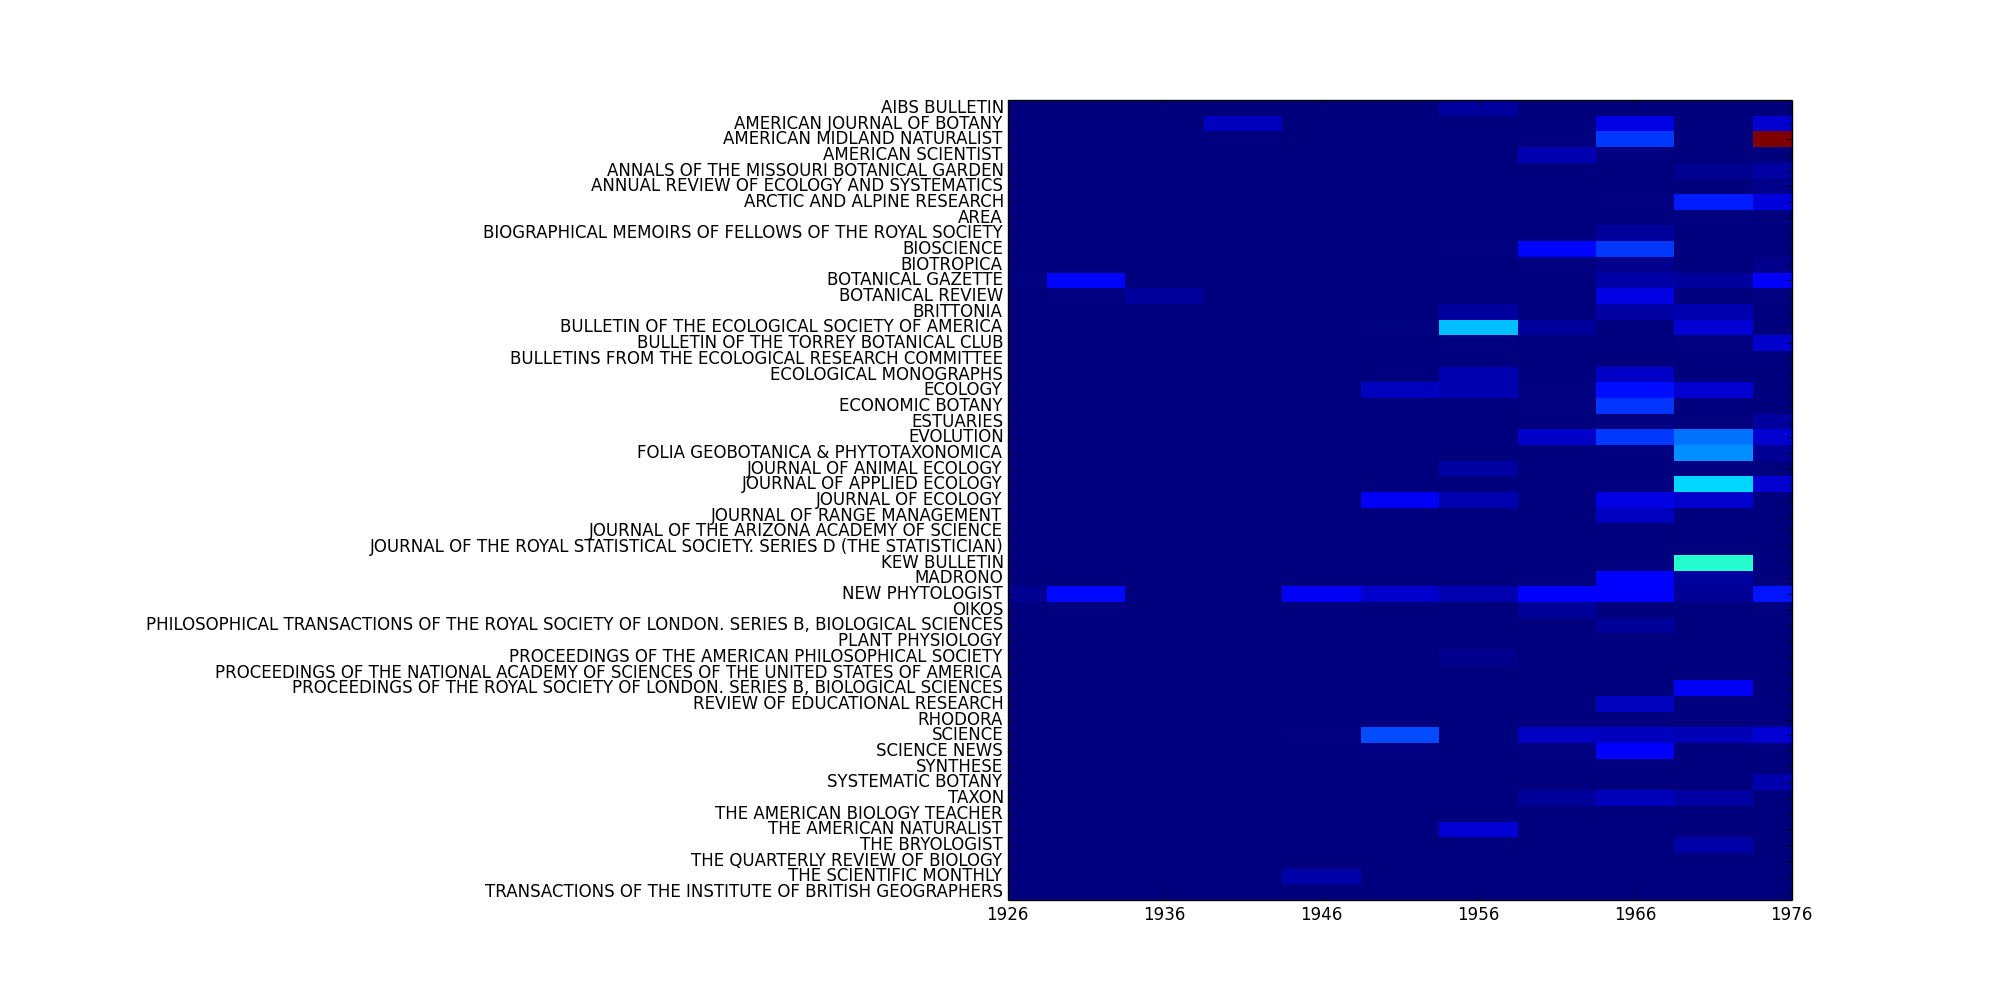
To generate a 2-dimensional plot using date and jtitle, you could do something like:
>>> MyCorpus.slice('date', method='time_period', window_size=5)
>>> MyCorpus.slice('jtitle')
>>> MyCorpus.plot_distribution('date', 'jtitle')
Which should generate a plot that looks something like:

If mode='features is set, this method will plot the distribution of a feature across x_axis (and y_axis). Set keyword arguments for Corpus.feature_distribution() using fkwargs.
>>> fkwargs = {
...     'featureset': 'unigrams',
...     'feature': 'four',
...     'mode': 'counts',
...     'normed': True,
...     }
>>> fig = MyCorpus.plot_distribution('date', 'jtitle', mode='features',
                              fkwargs=fkwargs, interpolation='none')
>>> fig.savefig('/path/to/dist.png')
- slice(key, method=None, **kwargs)[source]
Slices data by key, using method (if applicable).
In order to perform comparative analyses among your data, you must define the “axes” that you wish to compare by “slicing” your Corpus. You can slice by (theoretically) any field in your Papers, but most of the time you’ll be slicing by the date.
Here are some methods for slicing a Corpus, which you can specify using the method keyword argument.
Method Description Key kwargs time_window Slices data using a sliding time-window. Dataslices are indexed by the start of the time-window. date window_size step_size time_period Slices data into time periods of equal length. Dataslices are indexed by the start of the time period. date window_size The main difference between the sliding time-window (time_window) and the time-period (time_period) slicing methods are whether the resulting periods can overlap. Whereas time-period slicing divides data into subsets by sequential non-overlapping time periods, subsets generated by time-window slicing can overlap.

Time-period slicing, with a window-size of 4 years.
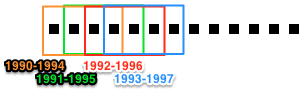
Time-window slicing, with a window-size of 4 years and a step-size of 1 year.
Avilable kwargs:
Argument Type Description window_size int Size of time-window or period, in years (default = 1). step_size int Amount to advance time-window or period in each step (ignored for time_period). cumulative bool If True, the data from each successive slice includes the data from all preceding slices. Only applies if key is ‘date’ (default = False). If you slice your Corpus by a field other than date, you do not need to specifiy a method or any other keyword arguments.
Once you have sliced your Corpus, you can use distribution() or plot_distribution() to generate descriptive statistics about your data.
Parameters: key : str
key in Paper by which to slice data.
method : str (optional)
Dictates how data should be sliced. See table for available methods. If key is ‘date’, default method is time_period with window_size and step_size of 1.
kwargs : kwargs
See methods table, above.
Examples
>>> MyCorpus.slice('date', method='time_period', window_size=5)
>>> MyCorpus.plot_distribution('date')
Should generate a plot that looks something like this:
- transform(fold, fnew, transformer=<function _tfidf at 0x10865a0c8>)[source]
Transform values in featureset fold, creating a new featureset fnew.
transformer is a method that will be applied to each feature in each document, returning a new value for that feature. It should accept the following parameters:
Parameter Description s Representation of the feature (e.g. string). c Value of the feature in the document (e.g. frequency). C Value of the feature in the Corpus (e.g. global frequency). DC Number of documents in which the feature occcurs. N Total number of documents in the Corpus. If transformer is not provided, the default behavior is a standard tf*idf transformation.
Parameters: fold : str
Name of the featureset to be transformed.
fnew : str
Name of the featureset to be created, with transformed values.
transformer : method
Applied to each feature in each document in the Corpus. See above.
Returns: None