tethne.classes.graphcollection module
A GraphCollection is a set of graphs generated from a Corpus or model.
- class tethne.classes.graphcollection.GraphCollection[source]
Bases: object
A GraphCollection is an indexed set of networkx.Graph objects generated from a Corpus or model.
A GraphCollection can be instantiated without any data.
>>> from tethne import GraphCollection
>>> G = GraphCollection()
When you add a networkx.Graph to the GraphCollection, all of the nodes are indexed and the graph is recast using integer IDs. This means that node IDs are consistent among all of the graphs in the collection.
>>> import networkx
>>> g = networkx.Graph()
>>> g.add_edge('Bob', 'Joe')
>>> g.add_edge('Bob', 'Jane')

>>> from tethne import GraphCollection
>>> G = GraphCollection()
>>> G[1950] = g

>>> print G[1950].nodes(data=True)
[(0, {'label': 'Jane'}), (1, {'label': 'Bob'}), (2, {'label': 'Joe'})]
Note that the original node names have been retained in the label attribute.
You can also generate a GraphCollection directly from a Corpus using the GraphCollection.build() method.
- attr_distribution(attr='weight', etype='edge', stat=<function mean at 0x104f771b8>)[source]
Generate summary statistics for a node or edge attribute across all of the networkx.Graphs in the GraphCollection.
Parameters: attr : str
Attribute name.
etype : str
‘node’ or ‘edge’
stat : method
Method to apply to the values in each Graph
Examples
To get the mean edge weight for each graph...
>>> import numpy
>>> keys, means = G.attr_distribution('weight', 'edge', numpy.mean)
>>> print keys
[1921, 1926, 1931, 1936, 1941, 1946, 1951, 1956, 1961, 1966, 1971, 1976]
>>> print means
[0.0, 1.0, 1.1388888888888888, 1.1428571428571428, 4.0, 1.25, 1.0, 1.0, 1.0344827586206897, 1.2142857142857142, 1.0089285714285714, 1.2]
- build(corpus, axis, node_type, graph_type, method_kwargs={}, **kwargs)[source]
Generates a graphs directly from data in a Corpus.
The networks module contains graph-building methods for authors, papers, features, and topics. Choose a method from one of these modules by specifying the module name in node_type and the method name in graph_type. That method will be applied to each slice in the Corpus, MyCorpus, along the specified axis.
To build a coauthorship network from a Corpus (already sliced by ‘date’):
>>> from tethne import GraphCollection
>>> G = GraphCollection().build(MyCorpus, 'date', 'authors', 'coauthors')
>>> G.graphs
{1921: <networkx.classes.graph.Graph at 0x10b2692d0>,
 1926: <networkx.classes.graph.Graph at 0x10b269c50>,
 1931: <networkx.classes.graph.Graph at 0x10b269c10>,
 1936: <networkx.classes.graph.Graph at 0x10b2695d0>,
 1941: <networkx.classes.graph.Graph at 0x10b269dd0>,
 1946: <networkx.classes.graph.Graph at 0x10a88bb90>,
 1951: <networkx.classes.graph.Graph at 0x10a88b0d0>,
 1956: <networkx.classes.graph.Graph at 0x10b269a50>,
 1961: <networkx.classes.graph.Graph at 0x10b269b50>,
 1966: <networkx.classes.graph.Graph at 0x10b269790>,
 1971: <networkx.classes.graph.Graph at 0x10b269d50>,
 1976: <networkx.classes.graph.Graph at 0x10a88bed0>}
Parameters: D : Corpus
Must already be sliced by axis.
axis : str
Name of slice axis to use in generating graphs.
node_type : str
Name of a graph-building module in networks.
graph_type : str
Name of a method in the module indicated by node_type.
method_kwargs : dict
Kwargs to pass to graph_type method.
Returns: self : GraphCollection
- compose()[source]
Returns the simple union of all the ``networkx.Graph``s in the GraphCollection.
Returns: composed : Graph
Simple union of all ``networkx.Graph``s in the GraphCollection.
Notes
Node or edge attributes that vary over slices should be ignored.
Examples
>>> g = G.compose()
>>> g
<networkx.classes.graph.Graph at 0x10bfac710>
- edge_distribution()[source]
Get the number of edges in each networkx.Graph in the GraphCollection.
Returns: keys : list
Graph indices.
values : list
Number of nodes in each Graph
Examples
>>> keys, edges = G.edge_distribution()
>>> print keys
[1921, 1926, 1931, 1936, 1941, 1946, 1951, 1956, 1961, 1966, 1971]
>>> print edges
[0, 1, 108, 7, 1, 4, 16, 17, 29, 42, 112]
- edge_history(source, target, attribute)[source]
Returns a dictionary of attribute vales for each Graph in the GraphCollection for a single edge.
Parameters: source : str
Identifier for source node.
target : str
Identifier for target node.
attribute : str
The attribute of interest; e.g. ‘betweenness_centrality’
Returns: history : dict
- edges(overwrite=False)[source]
Get the complete set of edges for this GraphCollection .
Parameters: overwrite : bool
If True, will generate new node list, even if one already exists.
Returns: edges : list
List (complete set) of edges for this GraphCollection .
Examples
>>> G.edges()
[(131, 143),
 (183, 222),
 (54, 55),
 (64, 51),
 (54, 58),
 .
 .
 (53, 56)]
- node_distribution()[source]
Get the number of nodes for each networkx.Graph in the GraphCollection.
Returns: keys : list
Graph indices.
values : list
Number of nodes in each graph.
Examples
>>> keys, nodes = G.node_distribution()
>>> print keys
[1921, 1926, 1931, 1936, 1941, 1946, 1951, 1956, 1961, 1966, 1971]
>>> print nodes
[0, 2, 16, 8, 2, 5, 14, 16, 33, 60, 44]
- node_history(node, attribute)[source]
Returns a dictionary of attribute values for each networkx.Graph in the GraphCollection for a single node.
Parameters: node : str
The node of interest.
attribute : str
The attribute of interest; e.g. ‘betweenness_centrality’
Returns: history : dict
- nodes()[source]
Get the complete set of nodes for this GraphCollection.
Returns: nodes : list
Complete list of unique node indices for this GraphCollection.
Examples
>>> G.nodes()
[0,
 1,
 2,
 3,
 4,
 .
 .
 233]
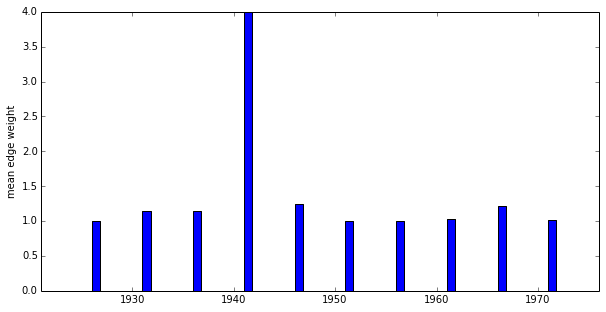
- plot_attr_distribution(attr='weight', etype='edge', stat=<function mean at 0x104f771b8>, type='bar', fig=None, plotargs={}, **kwargs)[source]
Plot GraphCollection.attr_distribution() using MatPlotLib.
Parameters: attr : str
Attribute name.
etype : str
‘node’ or ‘edge’
stat : method
Method to apply to the values in each Graph
type : str
‘plot’ or ‘bar’
plotargs
Passed to PyPlot method.
Returns: fig : matplotlib.figure.figure
Examples
>>> import numpy
>>> G.plot_attr_distribution('weight', 'edge', numpy.mean, fig=fig)
...should generate a plot that looks something like:
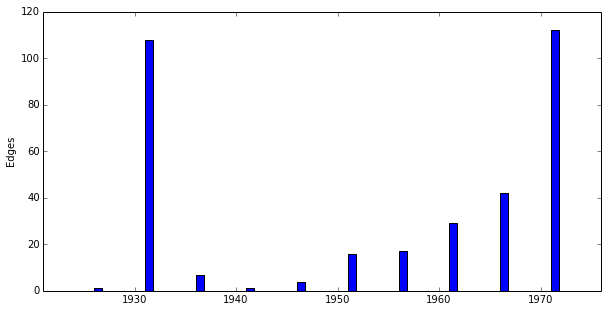
- plot_edge_distribution(type='bar', fig=None, plotargs={}, **kwargs)[source]
Plot GraphCollection.edge_distribution() using MatPlotLib.
Parameters: type : str
‘plot’ or ‘bar’
plotargs
Passed to PyPlot method.
Returns: fig : matplotlib.figure.figure
Examples
>>> fig = G.plot_edge_distribution()
...should generate a plot that looks like:
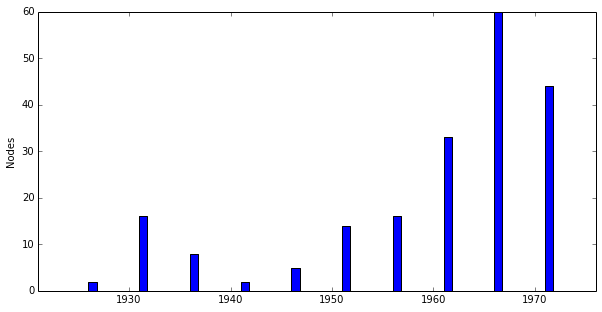
- plot_node_distribution(type='bar', fig=None, plotargs={}, **kwargs)[source]
Plot the values of node_distribution() using MatPlotLib.
Parameters: type : str
‘plot’ or ‘bar’
plotargs
Passed to PyPlot method.
Returns: fig : matplotlib.figure.figure
Examples
>>> fig = G.plot_node_distribution()
...should generate a plot that looks like:
![]()