tethne.networks.topics module
Build networks from topics in a topic model.
- tethne.networks.topics.distance(model, method='cosine', percentile=90, bidirectional=False, normalize=True, smooth=False, transform='log')[source]
Generate a network of Papers based on a distance metric from scipy.spatial.distance using Sparse feature vectors over the dimensions in model.
Refer to the documentation for analyze.features.distance() for a list of distance statistics. The only two methods that will not work in this context are hamming and jaccard.
Distances are inverted to a similarity metric, which is log-transformed by default (see transform parameter, below). Edges are included if they are at or above the ``percentile``th percentile.
Parameters: distance() uses model.item and model.metadata.
method : str
Name of a distance method from scipy.spatial.distance. See analyze.features.distance() for a list of distance statistics. hamming or jaccard will raise a RuntimeError. analyze.features.kl_divergence() is also available as ‘kl_divergence’.
percentile : int
(default: 90) Edges are included if they are at or above the percentile for all distances in the model.
bidirectional : bool
(default: False) If True, method is calculated twice for each pair of Papers ( (i,j) and (j,i) ), and the mean is used.
normalize : bool
(default: True) If True, vectors over topics are normalized so that they sum to 1.0 for each Paper.
smooth : bool
(default: False) If True, vectors over topics are smoothed according to Bigi 2003. This may be useful if vectors over topics are very sparse.
transform : str
(default: ‘log’) Transformation to apply to similarity values before building the graph. So far only ‘log’ and None are supported.
Returns: thegraph : networkx.Graph
Similarity values are included as edge weights. Node attributes are set using the fields in model.metadata.
Examples
>>> from tethne.networks import topics
>>> thegraph = topics.distance(MyLDAModel, 'cosine')

>>> from tethne.writers import graph
>>> graph.to_graphml(thegraph, '~./thegraph.graphml')
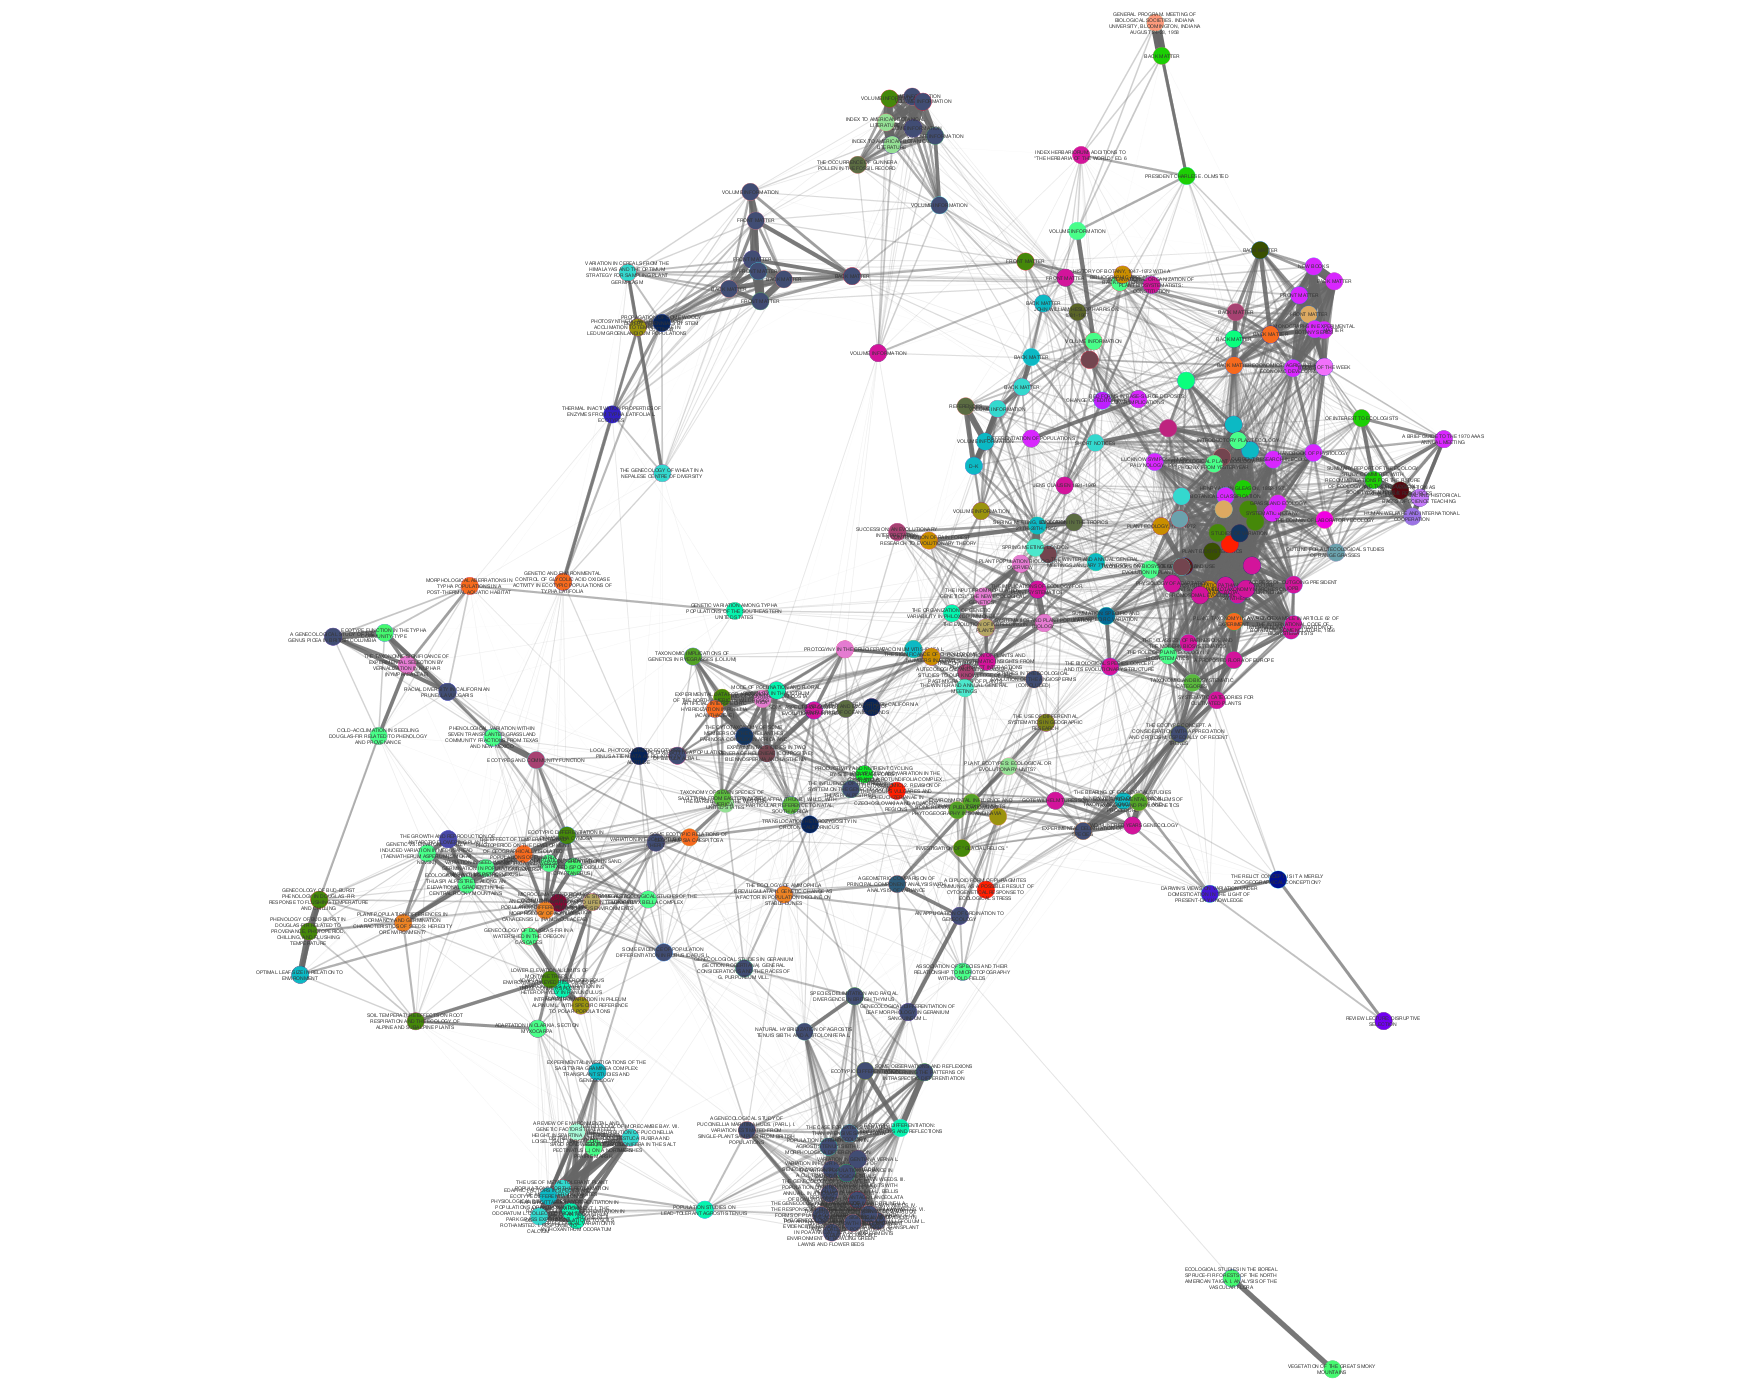
Edge weight and opacity indicate similarity. Node color indicates the journal in which each Paper was published. In this graph, papers published in the same journal tend to cluster together.
![]()