tethne.analyze.corpus module
Methods for analyzing Corpus objects.
| burstness | Estimate burstness profile for the topn features (or flist) in feature. |
| feature_burstness | Estimate burstness profile for a feature over the 'date' axis. |
| plot_burstness | Generate a figure depicting burstness profiles for feature. |
| plot_sigma | Plot sigma values for the topn most influential nodes. |
| sigma | Calculate sigma (from Chen 2009) for all of the nodes in a GraphCollection. |
- tethne.analyze.corpus.burstness(corpus, feature, k=5, topn=20, perslice=False, flist=None, normalize=True, **kwargs)[source]
Estimate burstness profile for the topn features (or flist) in feature.
Uses the popular burstness automaton model inroduced by Kleinberg (2002).
Parameters: corpus : Corpus
feature : str
Name of featureset in corpus. E.g. 'citations'.
k : int
(default: 5) Number of burst states.
topn : int or float {0.-1.}
(default: 20) Number (int) or percentage (float) of top-occurring features to return. If flist is provided, this parameter is ignored.
perslice : bool
(default: False) If True, loads topn features per slice. Otherwise, loads topn features overall. If flist is provided, this parameter is ignored.
flist : list
List of features. If provided, topn and perslice are ignored.
normalize : bool
(default: True) If True, burstness is expressed relative to the hightest possible state (k-1). Otherwise, states themselves are returned.
kwargs : kwargs
Parameters for burstness automaton HMM.
Returns: B : dict
Keys are features, values are tuples of ( dates, burstness )
Examples
>>> from tethne.analyze.corpus import burstness
>>> B = burstness(corpus, 'abstractTerms', flist=['process', 'method']
>>> B['process']
([1990, 1991, 1992, 1993], [0., 0.4, 0.6, 0.])
- tethne.analyze.corpus.feature_burstness(corpus, feature, findex, k=5, normalize=True, **kwargs)[source]
Estimate burstness profile for a feature over the 'date' axis.
Parameters: corpus : Corpus
feature : str
Name of featureset in corpus. E.g. 'citations'.
findex : int
Index of feature in corpus.
k : int
(default: 5) Number of burst states.
normalize : bool
(default: True) If True, burstness is expressed relative to the hightest possible state (k-1). Otherwise, states themselves are returned.
kwargs : kwargs
Parameters for burstness automaton HMM.
- tethne.analyze.corpus.plot_burstness(corpus, feature, k=5, topn=20, perslice=False, flist=None, normalize=True, fig=None, **kwargs)[source]
Generate a figure depicting burstness profiles for feature.
Parameters: corpus : Corpus
feature : str
Name of featureset in corpus. E.g. 'citations'.
k : int
(default: 5) Number of burst states.
topn : int or float {0.-1.}
(default: 20) Number (int) or percentage (float) of top-occurring features to return. If flist is provided, this parameter is ignored.
perslice : bool
(default: False) If True, loads topn features per slice. Otherwise, loads topn features overall. If flist is provided, this parameter is ignored.
flist : list
List of features. If provided, topn and perslice are ignored.
normalize : bool
(default: True) If True, burstness is expressed relative to the hightest possible state (k-1). Otherwise, states themselves are returned.
fig : matplotlib.figure.Figure
(default: None) You may provide a Figure instance if you wish. Otherwise, a new figure is generated.
kwargs : kwargs
Parameters for burstness automaton HMM.
Returns: fig : matplotlib.figure.Figure
Examples
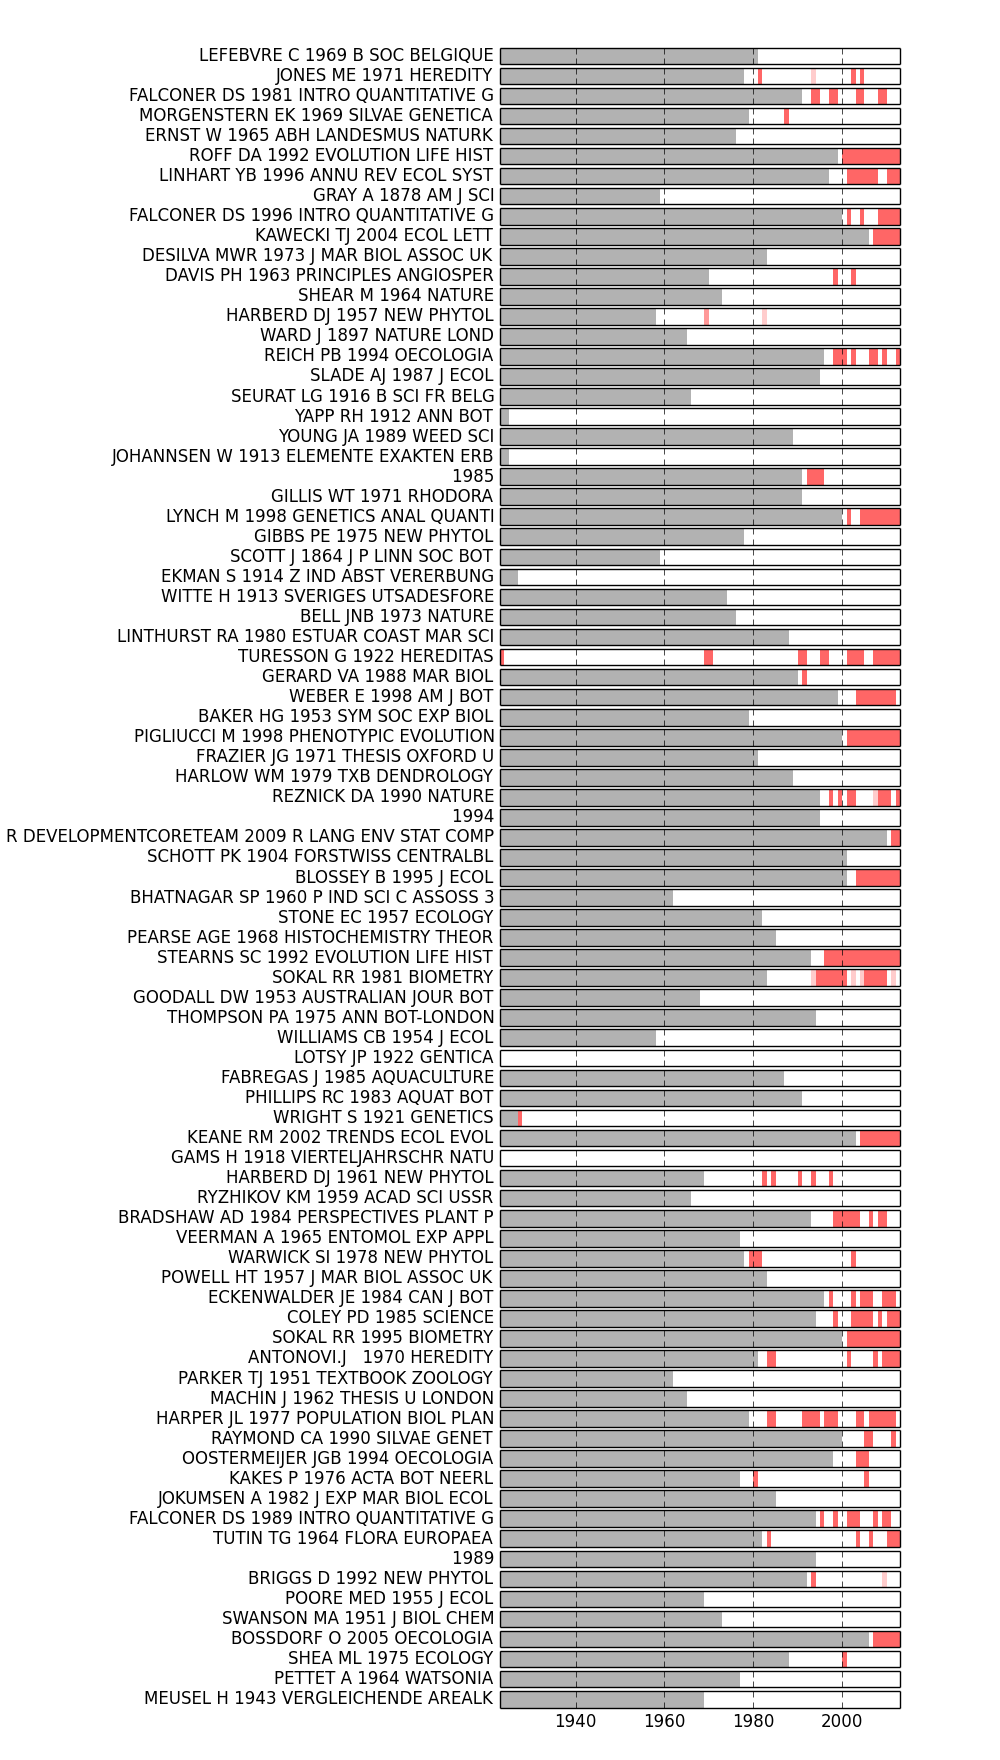
>>> from tethne.analyze.corpus import burstness
>>> fig = plot_burstness(corpus, 'citations', topn=2, perslice=True)
>>> fig.savefig('~/burstness.png')
Years prior to the first occurrence of each feature are grayed out. Periods in which the feature was bursty are depicted by colored blocks, the opacity of which indicates burstness intensity.
- tethne.analyze.corpus.plot_sigma(G, corpus, feature, topn=20, sort_by='max', perslice=False, flist=None, fig=None, **kwargs)[source]
Plot sigma values for the topn most influential nodes.
Parameters: G : GraphCollection
corpus : Corpus
feature : str
Name of a featureset in corpus.
topn : int or float {0.-1.}
(default: 20) Number (int) or percentage (float) of top-occurring features to return. If flist is provided, this parameter is ignored.
sort_by : str
(default: ‘max’) Criterion for selecting topn nodes.
perslice : bool
(default: False) If True, loads topn features per slice. Otherwise, loads topn features overall. If flist is provided, this parameter is ignored.
flist : list
List of nodes. If provided, topn and perslice are ignored.
fig : matplotlib.figure.Figure
(default: None) You may provide a Figure instance if you wish. Otherwise, a new figure is generated.
Returns: fig : matplotlib.figure.Figure
G : GraphCollection
A co-citation graph collection, updated with sigma node attributes.
Examples
Assuming that you have a Corpus (G) sliced by 'date' and a co-citation GraphCollection (corpus)...
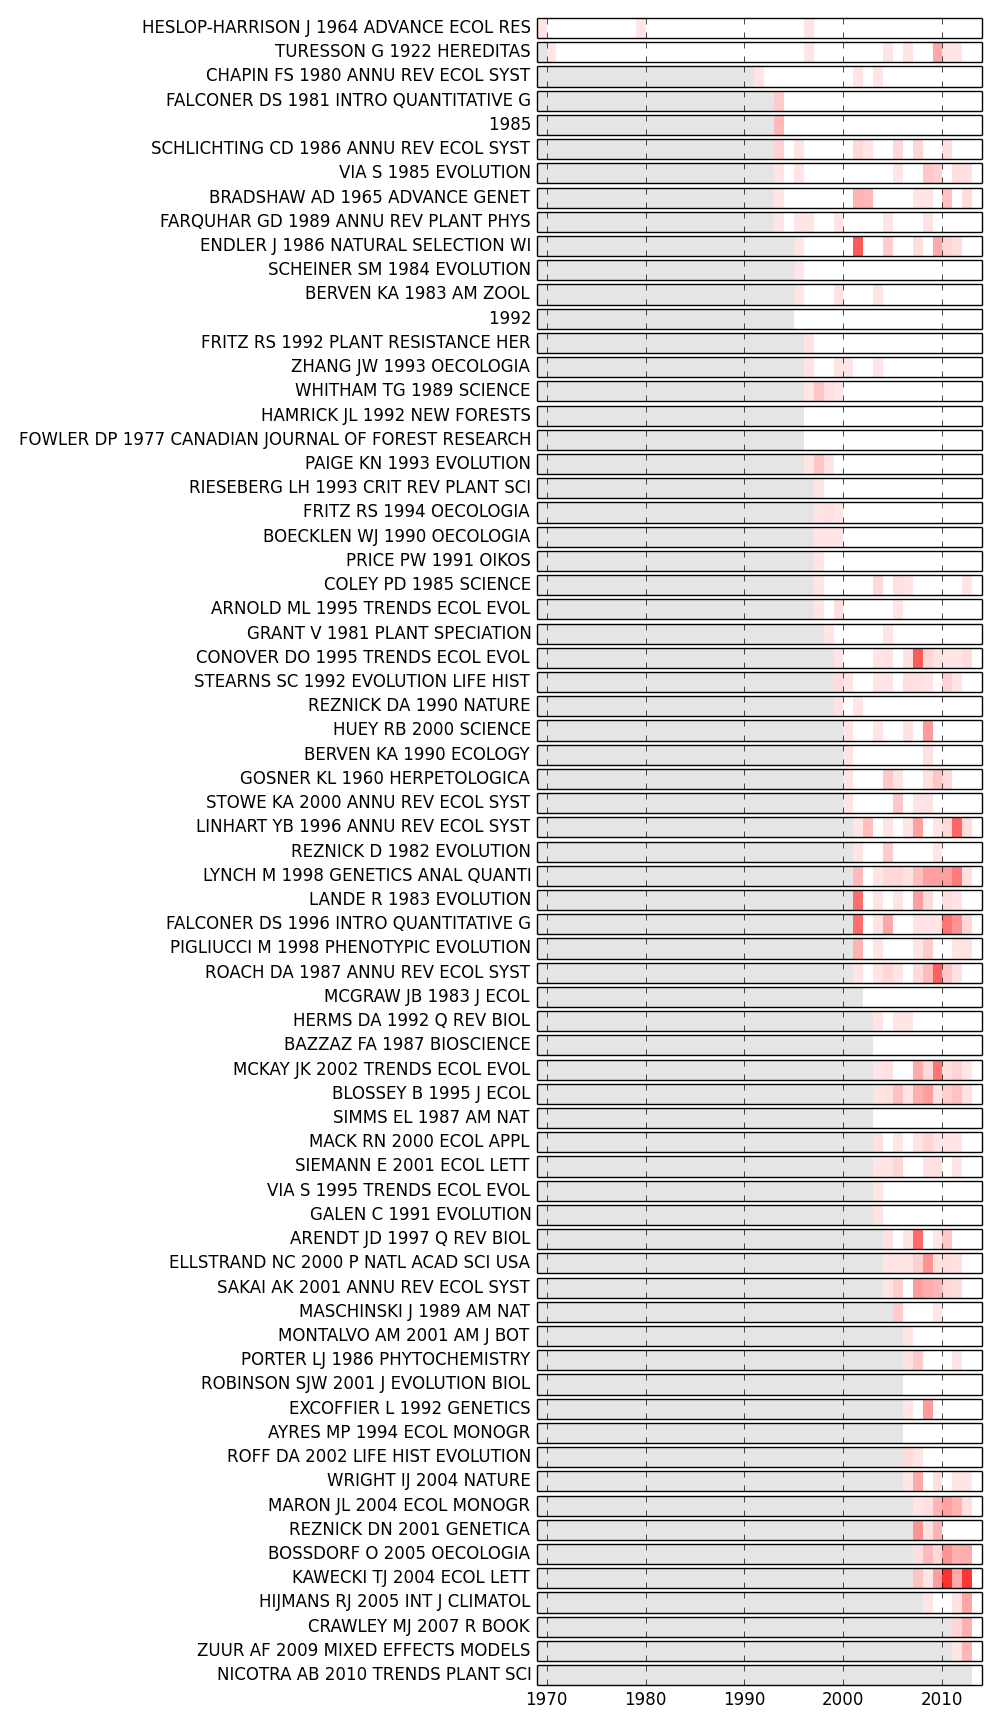
>>> from tethne.analyze.cocitation import plot_sigma
>>> fig,G = plot_sigma(G, corpus, topn=5, perslice=True)
>>> fig.savefig('~/sigma_plot.png')
In this figure, the top 5 most sigma-influential nodes in each slice are shown. Red bands indicate periods in which each paper was influential; opacity indicates the intensity of sigma (normalized by the highest value in the plot). The period prior to the first instance of each node is grayed out.
- tethne.analyze.corpus.sigma(G, corpus, feature, **kwargs)[source]
Calculate sigma (from Chen 2009) for all of the nodes in a GraphCollection.
You can set parameters for burstness estimation using kwargs:
Parameter Description s Scaling parameter ( > 1.)that controls graininess of burst detection. Lower values make the model more sensitive. Defaults to 1.1. gamma Parameter that controls the ‘cost’ of higher burst states. Defaults to 1.0. k Number of burst states. Defaults to 5. Parameters: G : GraphCollection
corpus : Corpus
feature : str
Name of a featureset in corpus.
Returns: G : GraphCollection
A graph collection updated with sigma node attributes.
Examples
Assuming that you have a Corpus generated from WoS data that has been sliced by date.
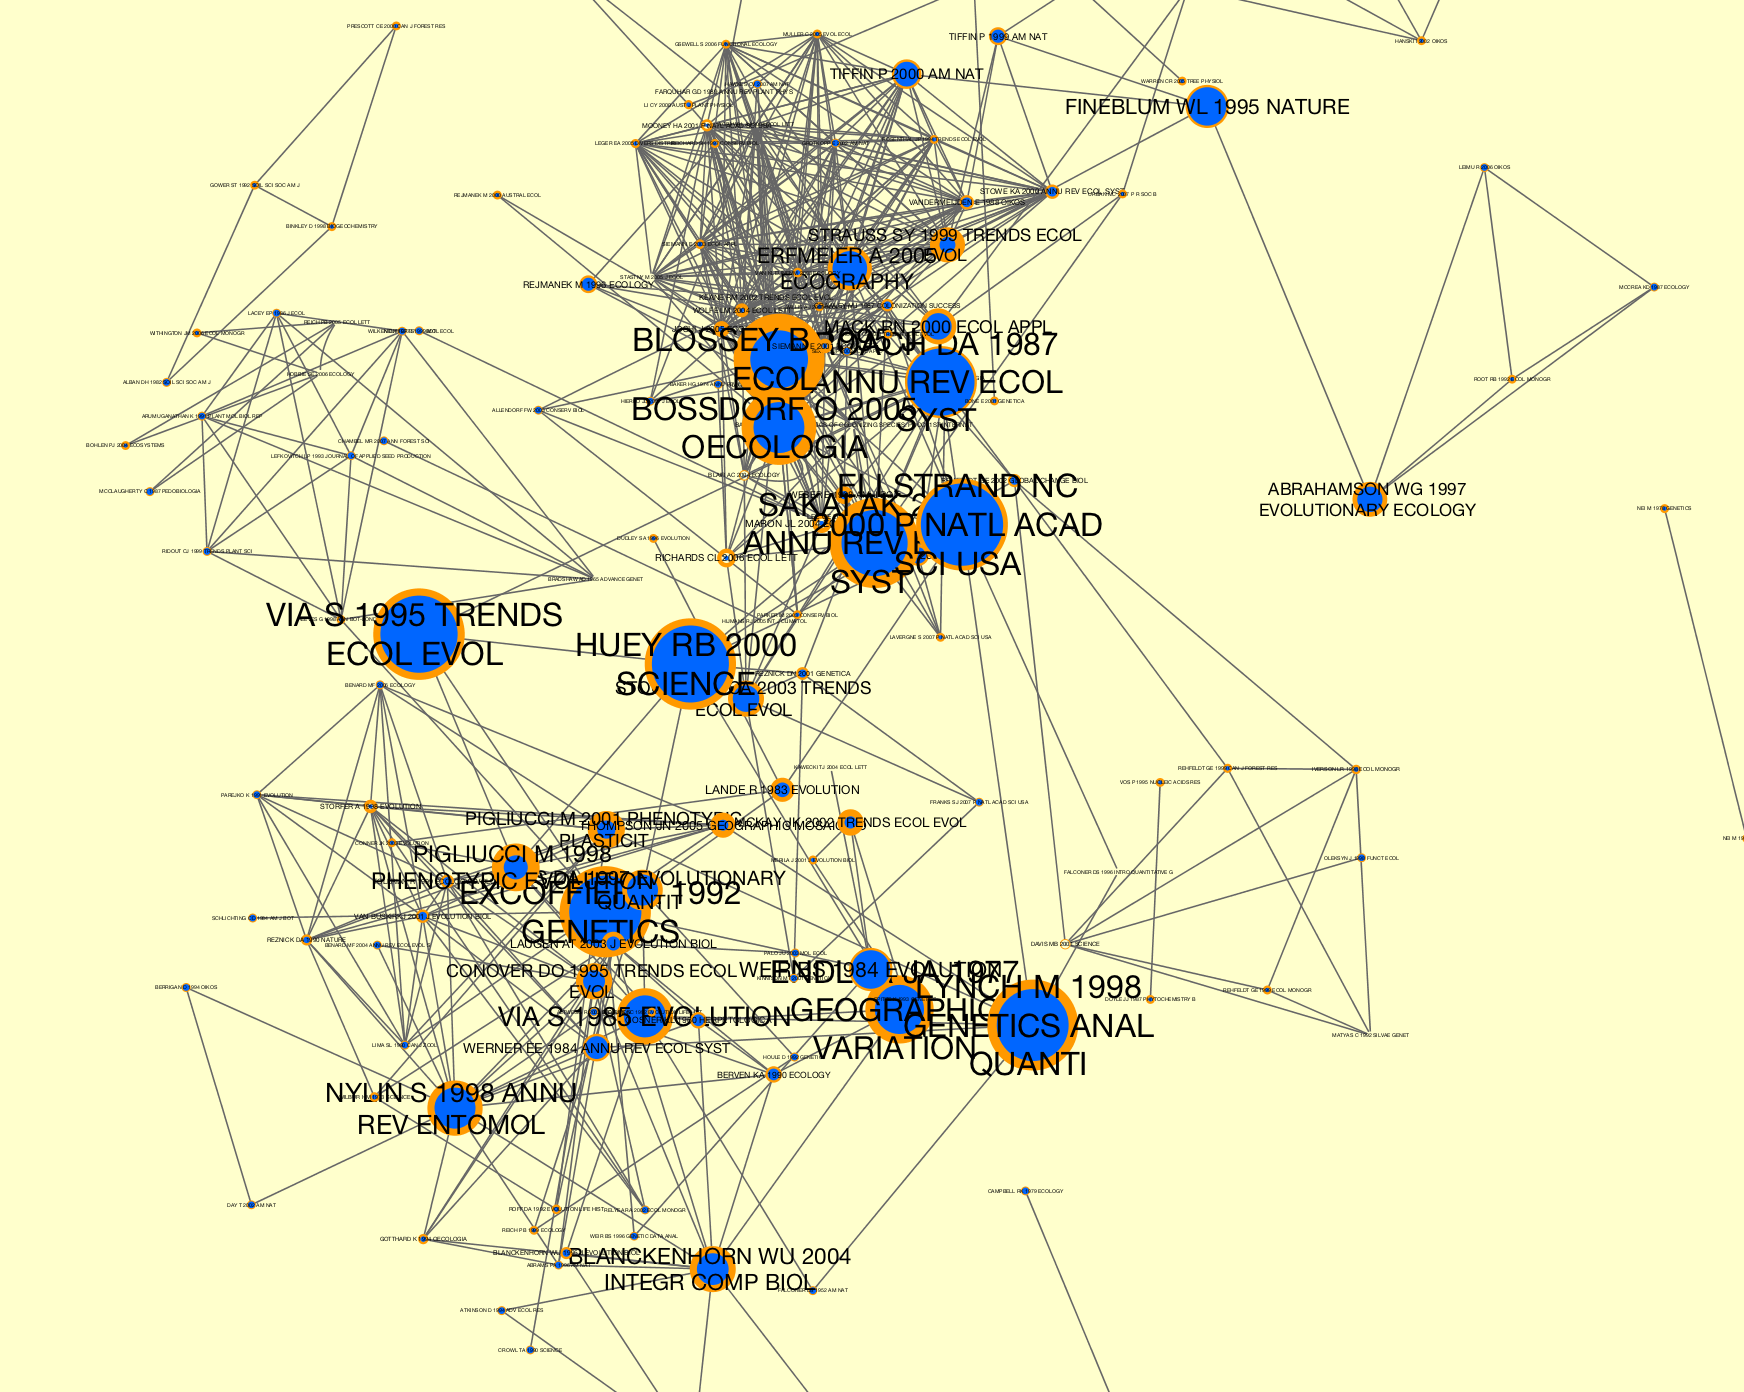
>>> # Generate a co-citation graph collection.
>>> from tethne import GraphCollection
>>> kwargs = { 'threshold':2, 'topn':100 }
>>> G = GraphCollection()
>>> G.build(corpus, 'date', 'papers', 'cocitation', method_kwargs=kwargs)

>>> # Calculate sigma. This may take several minutes, depending on the
>>> #  size of your co-citaiton graph collection.
>>> from tethne.analyze.corpus import sigma
>>> G = sigma(G, corpus, 'citations')

>>> # Visualize...
>>> from tethne.writers import collection
>>> collection.to_dxgmml(G, '~/cocitation.xgmml')
In the visualization below, node and label sizes are mapped to sigma, and border width is mapped to citations.