tethne.model.managers.dtm module
Classes and methods related to the DTMModelManager.
- class tethne.model.managers.dtm.DTMModelManager(D, feature='unigrams', outpath='/tmp', temppath=None, dtm_path='./bin/main')[source]
Bases: tethne.model.managers.ModelManager
Generates a DTMModel from a Corpus using Gerrish’s C++ implementation.
You should be sure to slice your Corpus by ‘date’ using the ‘time_period’ method (for details, see Corpus.slice()).
plot_topic_evolution Plot the probability of the top Nwords words in topic k over time. topic_over_time Representation of topic k over ‘date’ slice axis. Parameters: D : Corpus
outpath : str
Path to output directory.
dtm_path : str
Path to MALLET install directory (contains bin/mallet).
Examples
Starting with some JSTOR DfR data (with wordcounts), a typical workflow might look something like this:
>>> from nltk.corpus import stopwords                 #  1. Get stoplist.
>>> stoplist = stopwords.words()

>>> from tethne.readers import dfr                    #  2. Build Corpus.
>>> C = dfr.corpus_from_dir('/path/to/DfR/datasets', 'uni', stoplist)

>>> def filt(s, C, DC):                           # 3. Filter wordcounts.
...     if C > 3 and DC > 1 and len(s) > 3:
...         return True
...     return False
>>> C.filter_features('wordcounts', 'wc_filtered', filt)

>>> C.slice('date', 'time_period', window_size=5)     #  4. Slice Corpus.

>>> from tethne.model import DTMModelManager          #   5. Get Manager.
>>> outpath = '/path/to/my/working/directory'
>>> dtm = '/path/to/dtm/bin/main'
>>> M = DTMModelManager(C, 'wc_filtered', outpath, dtm_path=dtm)

>>> M.prep()                                          #    6. Prep model.

>>> model = M.build(Z=50)                             #   7. Build model.
>>> model                                             # (may take awhile)
<tethne.model.corpus.dtmmodel.DTMModel at 0x10bfac710>
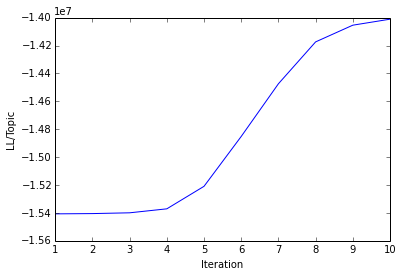
A plot showing the log-likelihood/topic over modeling iterations should be generated in your outpath. For example:
Behind the scenes, the prep() procedure generates data files at temppath describing your Corpus:
tethne-vocab.dat contains all of the words in the corpus, one per line.
tethne-mult.dat contains wordcounts for each document; words are represented by integer indices corresponding to line numbers in tethne-vocab.dat. Documents are ordered by publication date (earliest to latest).
tethne-seq.dat describes how documents are to be apportioned among time-periods. The first line is the number of time periods, and the subsequent lines specify the number of documents in each successive time-period.
tethne-meta.dat is a tab-delimted metadata file. Those records occur in the same order as in the documents in tethne-mult.dat. For example:
id       date    atitle
10.2307/2437162  1945    SOME ECOTYPIC RELATIONS OF DESCHAMPSIA CAESPITOSA
10.2307/4353229  1940    ENVIRONMENTAL INFLUENCE AND TRANSPLANT EXPERIMENTS
10.2307/4353158  1937    SOME FUNDAMENTAL PROBLEMS OF TAXONOMY AND PHYLOGENETICS
The build() procedure then starts the DTM modeling algorithm. This step may take a considerable amount of time, anywhere from a few minutes (small corpus, few topics) to a few hours (large corpus, many topics). Warning: this implementation of DTM is known to run into memory issues with large vocabularies. If a memory-leak does occur, try using a more restrictive filter to the featureset, using Corpus.filter_features().
Once the DTMModel is built, you can access its methods directly. See full method descriptions in DTMModel. Of special interest are:
DTMModel.list_topic_diachronic DTMModel.print_topic_diachronic DTMModel.topic_evolution Generate a plot that shows p(w|z) over time for the top Nwords terms. To plot the evolution of a topic over time, use plot_topic_evolution().
>>> M.plot_topic_evolution(2, plot=True)
...should generate a plot at outpath called topic_2_evolution.png:
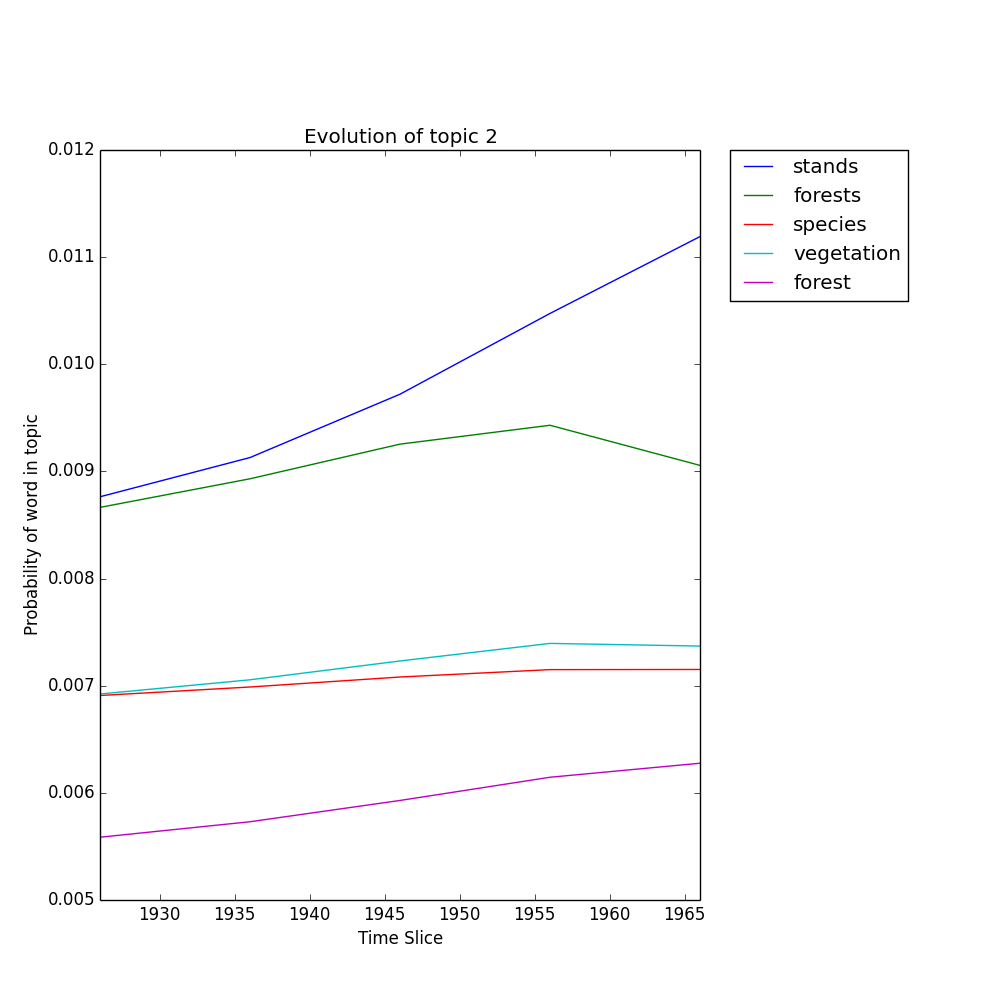
- plot_topic_evolution(k, Nwords=5, plot=False, figargs={'figsize': (10, 10)})[source]
Plot the probability of the top Nwords words in topic k over time.
If plot is True, generates a plot image at outpath.
TODO: should return a Figure object.
Parameters: k : int
Topic index.
Nwords : int
Number of words to include in plot.
plot : bool
(default: False) If True, generates a plot image at outpath.
figargs : dict
Keyword arguments to pass to matplotlib.pyplot.plot().
Returns: keys : list
Start-date of each time-period.
t_series : list
Array of p(w|t) for Nwords for each time-period.
Examples
>>> M.plot_topic_evolution(2, plot=True)
...should generate a plot at outpath called topic_2_evolution.png:
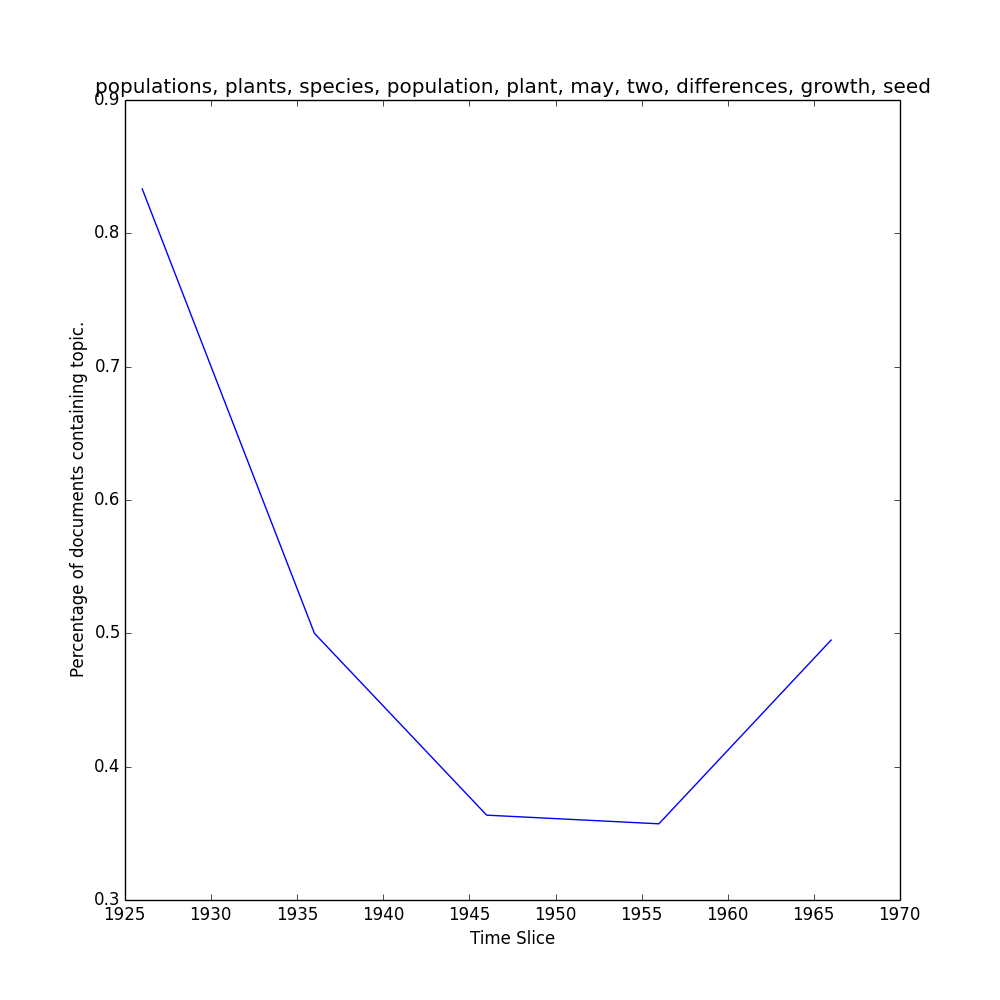
- topic_over_time(k, threshold=0.05, mode='documents', normed=True, plot=False, figargs={'figsize': (10, 10)})[source]
Representation of topic k over ‘date’ slice axis.
The Corpus used to initialize the DTMModelManager must have been already sliced by ‘date’.
Parameters: k : int
Topic index.
threshold : float
Minimum representation of k in a document.
mode : str
‘documents’ counts the number documents that contain k; ‘proportions’ sums the representation of k in each document that contains it.
normed : bool
(default: True) Normalizes values by the number of documents in each slice.
plot : bool
(default: False) If True, generates a MatPlotLib figure and saves it to the MALLETModelManager outpath.
figargs : dict
kwargs dict for matplotlib.pyplot.figure().
Returns: keys : array
Keys into ‘date’ slice axis.
R : array
Representation of topic k over time.
Examples
>>> keys, repr = M.topic_over_time(1, plot=True)
...should return keys (date) and repr (% documents) for topic 1, and generate a plot like this one in your outpath.