tethne.model.managers.mallet module
Classes and methods related to the MALLETModelManager.
- class tethne.model.managers.mallet.MALLETModelManager(D, feature='unigrams', outpath='/tmp/', temppath=None, mallet_path='./model/bin/mallet-2.0.7')[source]
Bases: tethne.model.managers.ModelManager
Generates a LDAModel from a Corpus using MALLET.
The Corpus should already contain at least one featurset, indicated by the feature parameter, such as wordcounts. You may specify two working directories: temppath should be a working directory that will contain intermediate files (e.g. documents, data files, metadata), while outpath will contain the final model and any plots generated during the modeling process. If temppath is not provided, generates and uses a system temporary directory.
Tethne comes bundled with a recent version of MALLET. If you would rather use your own install, you can do so by providing the mallet_path parameter. This should point to the directory containing /bin/mallet.
topic_over_time Representation of topic k over ‘date’ slice axis. Parameters: D : Corpus
feature : str
Key from D.features containing wordcounts (or whatever you want to model with).
outpath : str
Path to output directory.
temppath : str
Path to temporary directory.
mallet_path : str
Path to MALLET install directory (contains bin/mallet).
Examples
Starting with some JSTOR DfR data (with wordcounts), a typical workflow might look something like this:
>>> from nltk.corpus import stopwords                 #  1. Get stoplist.
>>> stoplist = stopwords.words()

>>> from tethne.readers import dfr                    #  2. Build Corpus.
>>> C = dfr.corpus_from_dir('/path/to/DfR/datasets', 'uni', stoplist)

>>> def filt(s, C, DC):                           # 3. Filter wordcounts.
...     if C > 3 and DC > 1 and len(s) > 3:
...         return True
...     return False
>>> C.filter_features('wordcounts', 'wc_filtered', filt)

>>> from tethne.model import MALLETModelManager       #   4. Get Manager.
>>> outpath = '/path/to/my/working/directory'
>>> mallet = '/Applications/mallet-2.0.7'
>>> M = MALLETModelManager(C, 'wc_filtered', outpath, mallet_path=mallet)

>>> M.prep()                                          #    5. Prep model.

>>> model = M.build(Z=50, max_iter=300)               #   6. Build model.
>>> model                                             # (may take awhile)
<tethne.model.corpus.ldamodel.LDAModel at 0x10bfac710>
A plot showing the log-likelihood/topic over modeling iterations should be generated in your outpath. For example:
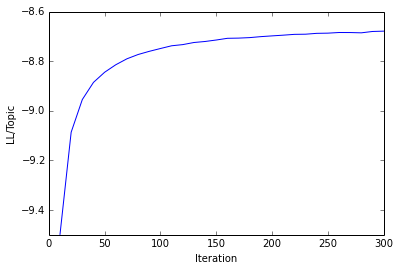
Behind the scenes, the prep() procedure generates a plain-text corpus file at temppath, along with a metadata file. MALLET’s import-file procedure is then called, which translates the corpus into MALLET’s internal format (also stored at the temppath).
The build() procedure then invokes MALLET’s train-topics procedure. This step may take a considerable amount of time, anywhere from a few minutes (small corpus, few topics) to a few hours (large corpus, many topics).
For a Corpus with a few thousand Papers, 300 - 500 iterations is often sufficient to achieve convergence for 20-100 topics.
Once the LDAModel is built, you can access its methods directly. See full method descriptions in LDAModel.
For more information about topic modeling with MALLET see this tutorial.
- topic_over_time(k, threshold=0.05, mode='documents', normed=True, plot=False, figargs={'figsize': (10, 10)})[source]
Representation of topic k over ‘date’ slice axis.
The Corpus used to initialize the LDAModelManager must have been already sliced by ‘date’.
Parameters: k : int
Topic index.
threshold : float
Minimum representation of k in a document.
mode : str
‘documents’ counts the number documents that contain k; ‘proportions’ sums the representation of k in each document that contains it.
normed : bool
(default: True) Normalizes values by the number of documents in each slice.
plot : bool
(default: False) If True, generates a MatPlotLib figure and saves it to the MALLETModelManager outpath.
figargs : dict
kwargs dict for matplotlib.pyplot.figure().
Returns: keys : array
Keys into ‘date’ slice axis.
R : array
Representation of topic k over time.
Examples
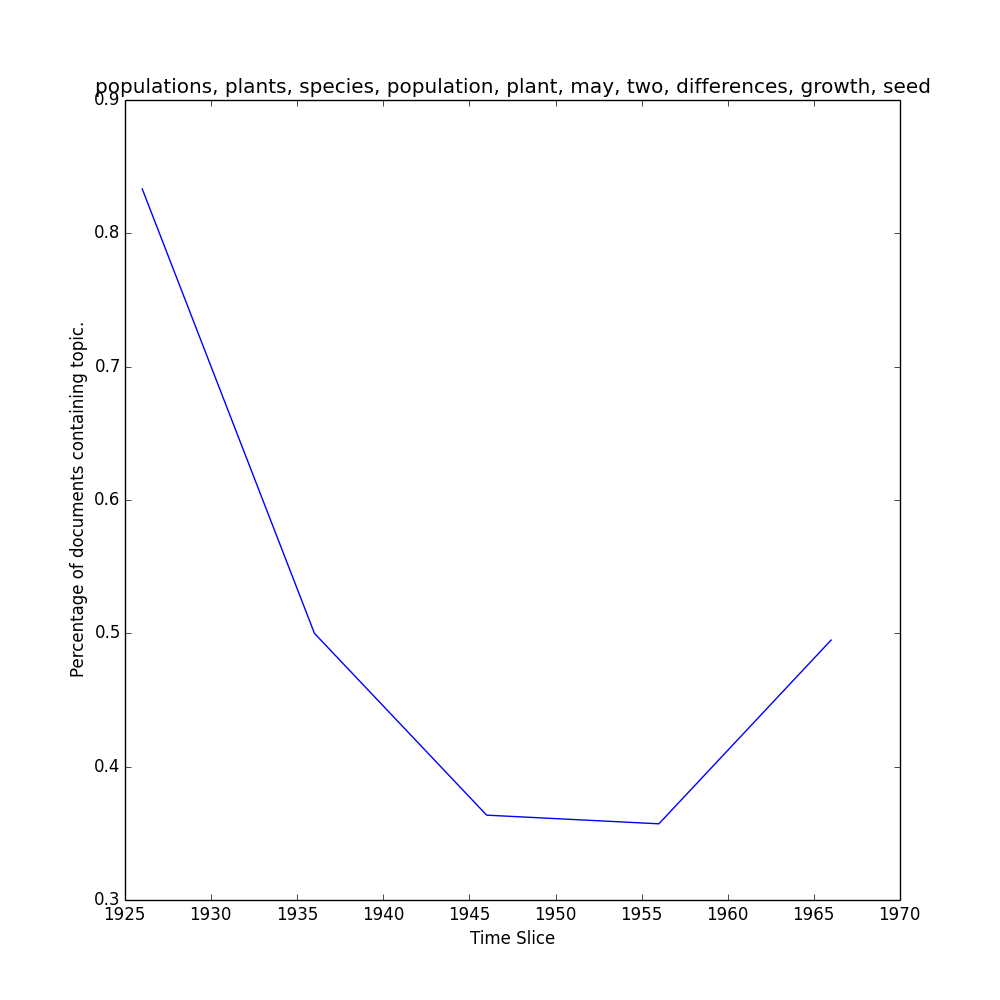
>>> keys, repr = M.topic_over_time(1, plot=True)
...should return keys (date) and repr (% documents) for topic 1, and generate a plot like this one in your outpath.
![]()
Previous topic
tethne.model.managers.dtm module
Next topic
tethne.model.managers.tap module