Quickstart
Load some data
Assuming that you have a JSTOR DfR dataset (in XML format) containing some wordcount data unzipped at /path/to/my/dataset, create a Corpus with:
>>> from tethne.readers import dfr
>>> C = dfr.read_corpus('/path/to/my/dataset', 'uni')
Or if you’re working with data from the Web of Science, try:
>>> from tethne.readers import wos
>>> C = dfr.read_corpus('/path/to/my/wosdata.txt')
Index your Corpus by publication date and journal using the tethne.classes.corpus.Corpus.slice() method.
>>> C.slice('date', method='time_period', window_size=5)
>>> C.slice('jtitle')
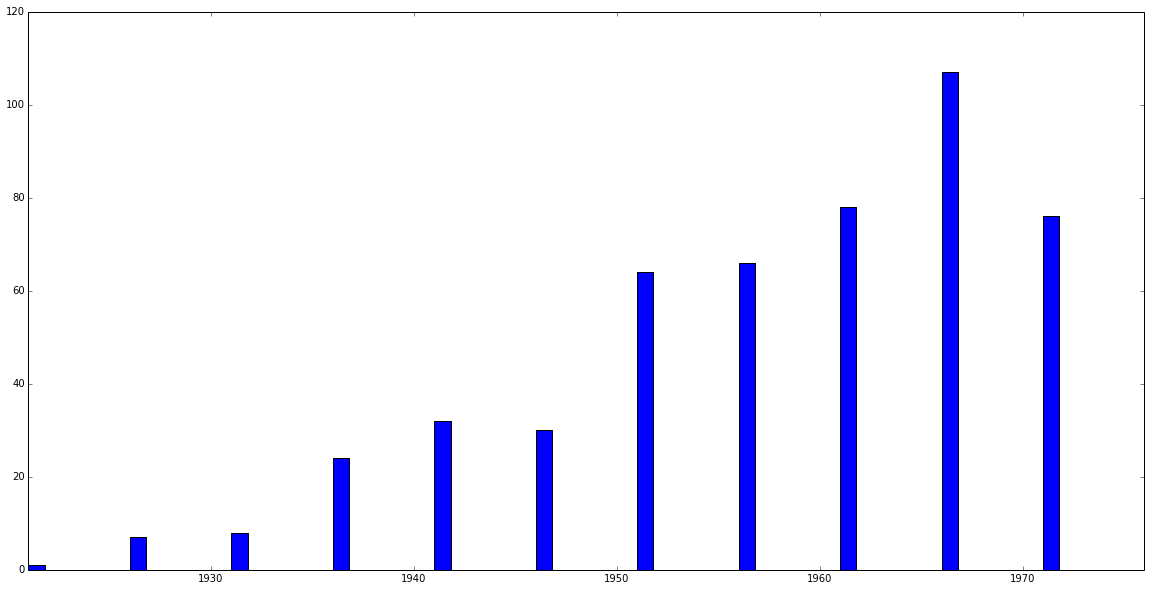
Now use tethne.classes.corpus.Corpus.plot_distribution() to see how your Papers are distributed over time...
>>> C.plot_distribution('date')
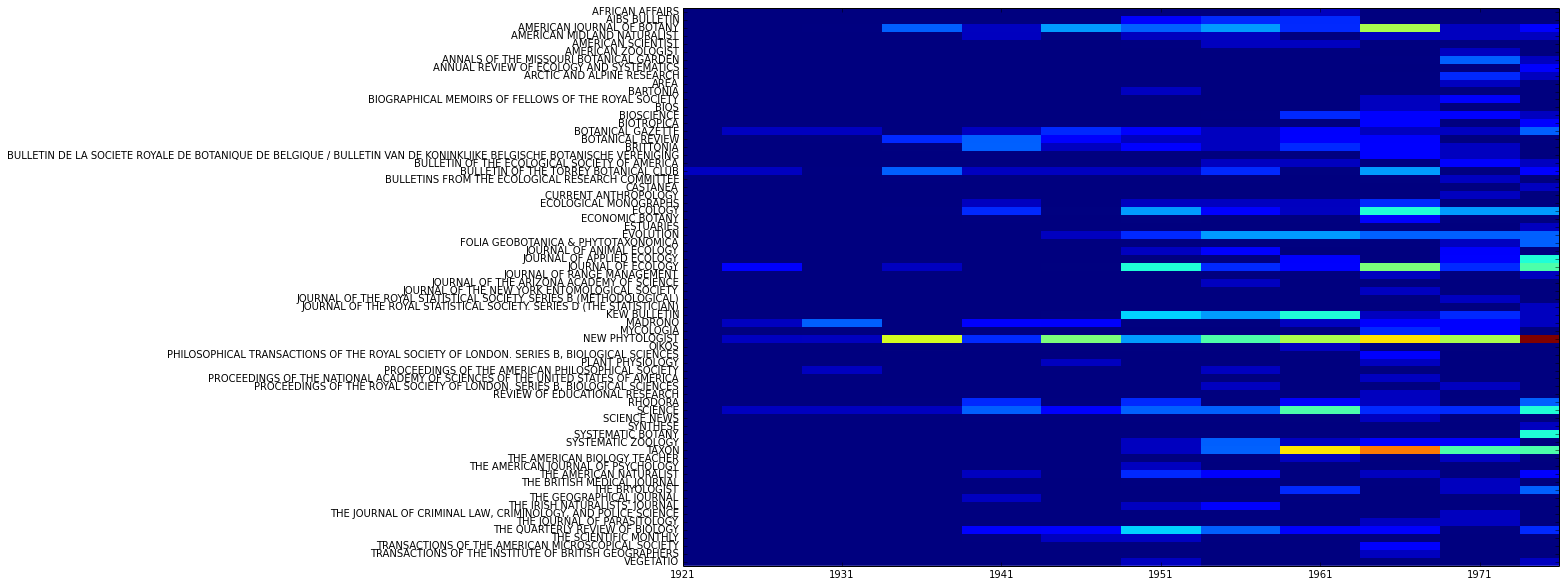
...or by both time and journal:
>>> C.plot_distribution('date', 'jtitle')
Simple networks simply
Network-building methods are in networks. You can create a coauthorship network like this:
>>> from tethne.networks import authors
>>> coauthors = authors.coauthors(C)
To introduce a temporal component, slice your Corpus and then create a GraphCollection (cumulative=True means that the coauthorship network will grow over time without losing old connections):
>>> C.slice('date', 'time_period', window_size=5, cumulative=True)   # 5-year bins.
>>> from tethne import GraphCollection
>>> G = GraphCollection().build(C, 'date', 'authors', 'coauthors')
If you’re using WoS data (with citations), you can also build citation-based graphs (see networks.papers). Here’s a static co-citation graph from a Corpus:
>>> C.slice('date', 'time_period', window_size=5) # No need for `cumulative` here.
>> from tethne.networks import papers
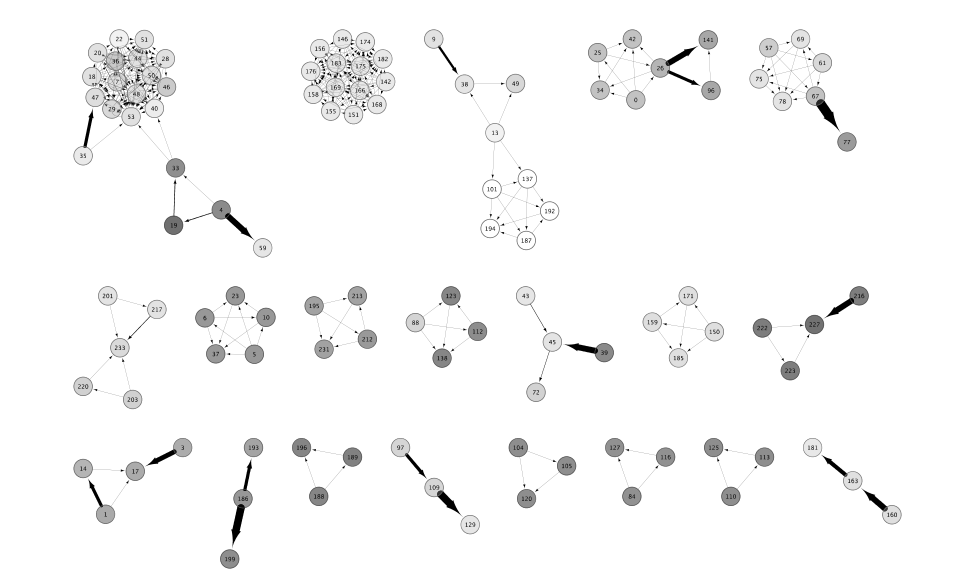
>>> cocitation = papers.cocitation(C.all_papers(), threshold=2, topn=300)
threshold=2 means that papers must be co-cited twice, and topn=300 means that only the top 300 most cited papers will be included.
To see a time-variant co-citation network, build a GraphCollection just as before:
>>> G = GraphCollection().build(C, 'date', 'papers', 'cocitation', threshold=2, topn=300)
Visualize your networks
You can export a graph for visualization in Cytoscape using writers:
>>> from tethne.writers import graph
>>> graph.to_graphml(coauthors, '/path/to/my/graph.graphml')
To visualize a GraphCollection as a dynamic graph in Cytoscape, export it using writers.collection.to_dxgmml():
>>> from tethne.writers import collection
>>> collection.to_dxgmml(G, '/path/to/my/dynamicNetwork.xgmml')
Working with Words
Suppose you loaded up a Corpus from some DfR datasets, using:
>>> from tethne.readers import dfr
>>> C = dfr.corpus_from_dir('/path/to/my/dataset', 'uni')
Now you have some 'unigrams' in C.features. There are surely plenty of junk words in there. You can apply a stoplist when you load the Corpus, by passing it to exclude:
>>> from nltk.corpus import stopwords
>>> stoplist = stopwords.words()
>>> from tethne.readers import dfr
>>> C = dfr.corpus_from_dir('/path/to/my/dataset', 'uni', exclude=stoplist)
If you have some recent WoS data with abstracts, you can get a featureset from abstract terms, too:
>>> from tethne.readers import wos
>>> C = dfr.read_corpus('/path/to/my/wosdata.txt')
>>> C.abstract_to_features() # Automatically applies a stoplist.
Filter the words in the Corpus further, using Corpus.filter_features(). Maybe you only want words that occur more than three times overall, occur in more than one document, and are at least four characters in length.
>>> def filt(s, C, DC):
...     if C > 3 and DC > 1 and len(s) > 3:
...         return True
...     return False
>>> C.filter_features('unigrams', 'wordcounts_filtered', filt)
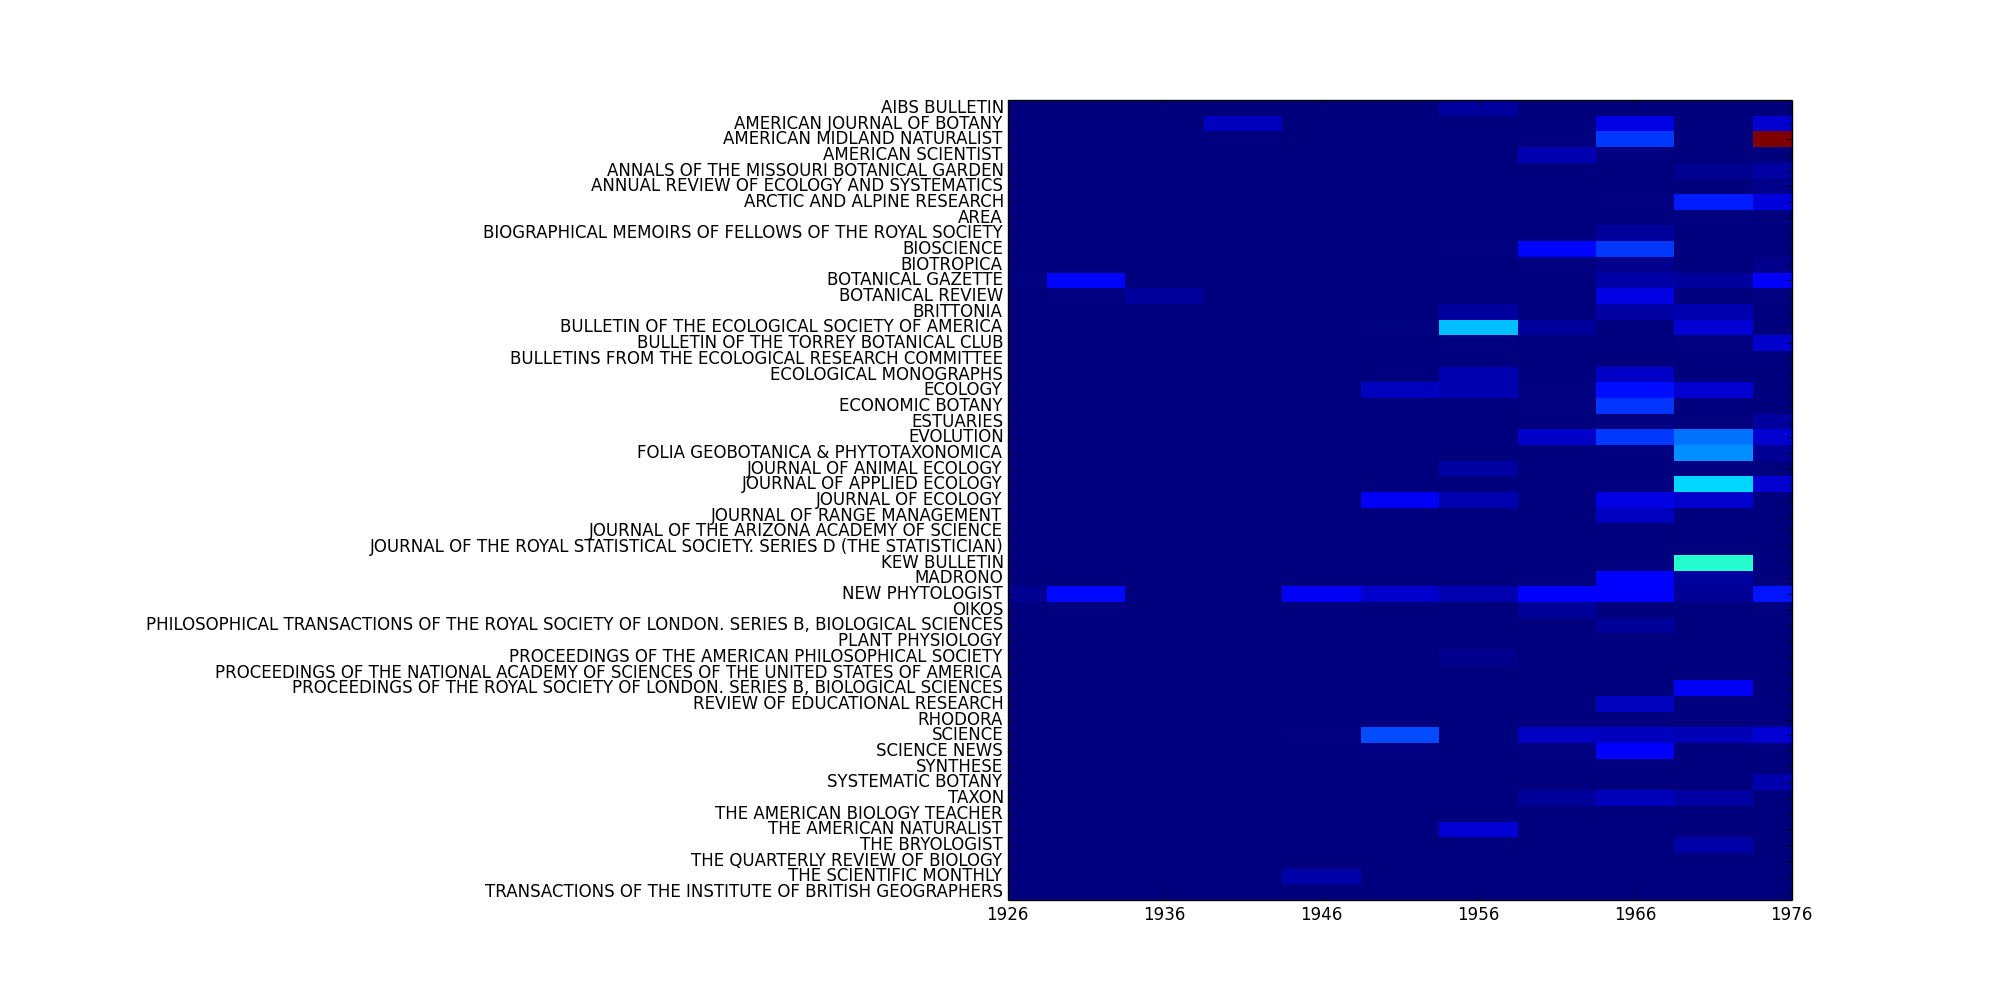
You can see how the word four is distributed across your Corpus using Corpus.plot_distribution():
>>> C.slice('date', method='time_period', window_size=5)
>>> C.slice('jtitle')
>>> fkwargs = {
...     'featureset': 'wordcounts_filtered',
...     'feature': 'four',
...     'mode': 'counts',
...     'normed': True,
...     }
>>> fig = C.plot_distribution('date', 'jtitle', mode='features',
                              fkwargs=fkwargs, interpolation='none')
>>> fig.savefig('/path/to/dist.png')
Models Based on Words
Topic models are pretty popular. You can create a LDA topic model with MALLET using a MALLETModelManager. First, get the manager:
>>> from tethne.model import MALLETModelManager
>>> outpath = '/path/to/my/working/directory'
>>> mallet = '/Applications/mallet-2.0.7'    # Path to MALLET install directory.
>>> M = MALLETModelManager(C, 'wordcounts_filtered', outpath, mallet_path=mallet)
Now prep and build. Here’s an example for 50 topics:
>>> M.prep()
>>> model = M.build(Z=50, max_iter=300)  # May take a while.
Here are the top 5 words in topic 1:
>>> model.print_topic(1, Nwords=5)
'opposed, terminates, trichinosis, cistus, acaule'
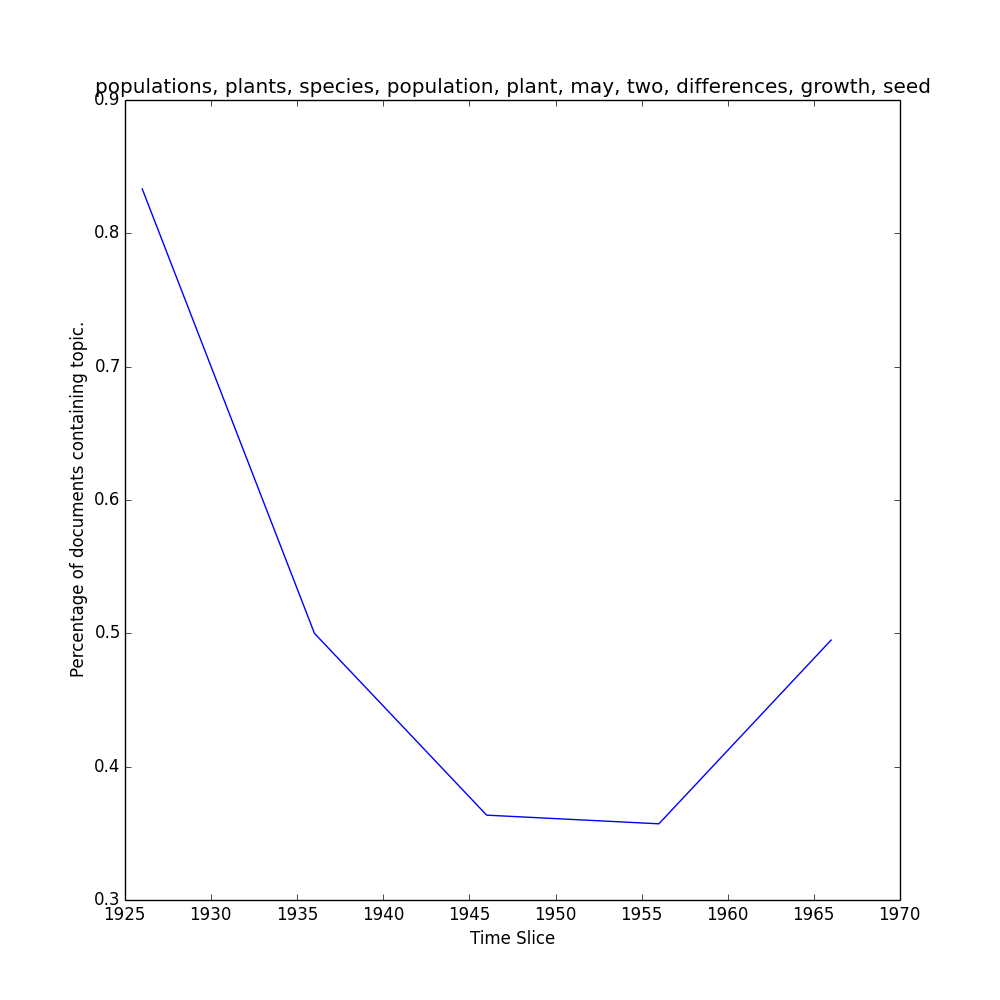
To view the representation of topic 1 over the slices in the Corpus...
>>> keys, repr = M.topic_over_time(1, plot=True)
...which should return keys (date) and repr (% documents) for topic 1, and generate a plot like this one in your outpath.
Combining corpus models and social models
Social models (see model.social) represent the dynamics of social influence in terms of behavior adoption. Writing about a topic is a behavior.
Suppose you have a coauthorship GraphCollection...
>>> C.slice('date', 'time_period', window_size=5, cumulative=True)
>>> from tethne import GraphCollection
>>> G = GraphCollection().build(C, 'date', 'authors', 'coauthors')
...and the LDAModel (model) from the last section.
You can use the TAPModelManager to generate a TAPModel, which represents a Topical Affinity Propagation social influence model.
>>> from tethne.model import TAPModelManager
>>> T = TAPModelManager(C, G, model)
>>> T.build()                # This may take a while.
You can get the social influence GraphCollection for topic 1:
>>> IG = T.graph_collection(0)
Since you used cumulative=True when creating the coauthors GraphCollection, the latest graph in the social influence GraphCollection is the most interesting:
>>> ig = IG[sorted(IG.graphs.keys())[-1]]
Write it to GraphML:
>>> from tethne.writers import graph
>>> graph.to_graphml(ig, '/path/to/my/graph.graphml')
And then visualize it in Cytoscape or Gephi.